Pizza Hut 2011 Annual Report Download - page 130
Download and view the complete annual report
Please find page 130 of the 2011 Pizza Hut annual report below. You can navigate through the pages in the report by either clicking on the pages listed below, or by using the keyword search tool below to find specific information within the annual report.-
 1
1 -
2
-
3
-
4
-
5
-
6
-
7
-
8
-
9
-
10
-
11
-
12
-
13
-
14
-
15
-
16
-
17
-
18
-
19
-
20
-
21
-
22
-
23
-
24
-
25
-
26
-
27
-
28
-
29
-
30
-
31
-
32
-
33
-
34
-
35
-
36
-
37
-
38
-
39
-
40
-
41
-
42
-
43
-
44
-
45
-
46
-
47
-
48
-
49
-
50
-
51
-
52
-
53
-
54
-
55
-
56
-
57
-
58
-
59
-
60
-
61
-
62
-
63
-
64
-
65
-
66
-
67
-
68
-
69
-
70
-
71
-
72
-
73
-
74
-
75
-
76
-
77
-
78
-
79
-
80
-
81
-
82
-
83
-
84
-
85
-
86
-
87
-
88
-
89
-
90
-
91
-
92
-
93
-
94
-
95
-
96
-
97
-
98
-
99
-
100
-
101
-
102
-
103
-
104
-
105
-
106
-
107
-
108
-
109
-
110
-
111
-
112
-
113
-
114
-
115
-
116
-
117
-
118
-
119
-
 120
120 -
 121
121 -
 122
122 -
 123
123 -
 124
124 -
 125
125 -
 126
126 -
 127
127 -
 128
128 -
 129
129 -
 130
130 -
 131
131 -
 132
132 -
 133
133 -
 134
134 -
 135
135 -
 136
136 -
 137
137 -
 138
138 -
 139
139 -
 140
140 -
141
-
142
-
143
-
144
-
145
-
146
-
147
-
148
-
149
-
150
-
151
-
152
-
153
-
154
-
155
-
156
-
157
-
158
-
159
-
160
-
161
-
162
-
163
-
164
-
165
-
166
-
167
-
168
-
169
-
170
-
171
-
172
-
173
-
174
-
175
-
176
-
177
-
178
-
179
-
180
-
181
-
182
-
183
-
184
-
185
-
186
-
187
-
188
-
189
-
190
-
191
-
192
-
193
-
194
-
195
-
196
-
197
-
198
-
199
-
200
-
201
-
202
-
203
-
204
-
205
-
206
-
207
-
208
-
209
-
210
-
211
-
212
 |
 |

26
of the transaction. The write-off of goodwill included in this loss was minimal as our Mexico reporting unit included an insignificant
amount of goodwill. This loss did not result in a related income tax benefit.
During the year ended December 26, 2009 we recognized a non-cash $10 million refranchising loss as a result of our decision to
offer to refranchise our KFC Taiwan equity market. During the year ended December 25, 2010 we refranchised all of our remaining
company restaurants in Taiwan, which consisted of 124 KFCs. We included in our December 25, 2010 financial statements a non-
cash write-off of $7 million of goodwill in determining the loss on refranchising of Taiwan. Neither of these losses resulted in a
related income tax benefit. The amount of goodwill write-off was based on the relative fair values of the Taiwan business disposed
of and the portion of the business that was retained. The fair value of the business disposed of was determined by reference to
the discounted value of the future cash flows expected to be generated by the restaurants and retained by the franchisee, which
included a deduction for the anticipated royalties the franchisee was estimated to pay the Company associated with the franchise
agreement entered into in connection with this refranchising transaction. The fair value of the Taiwan business retained consisted
of expected net cash flows to be derived from royalties from franchisees, including the royalties associated with the franchise
agreement entered into in connection with this refranchising transaction. We believe the terms of the franchise agreement entered
into in connection with the Taiwan refranchising were substantially consistent with market. The remaining carrying value of
goodwill related to our Taiwan business of $30 million, was determined not to be impaired subsequent to the refranchising as the
fair value of the Taiwan reporting unit exceeded its carrying amount.
Consolidation of a Former Unconsolidated Affiliate in Shanghai, China
On May 4, 2009 we acquired an additional 7% ownership in the entity that operates more than 200 KFCs in Shanghai, China for
$12 million, increasing our ownership to 58%. Prior to our acquisition of this additional interest, this entity was accounted for as
an unconsolidated affiliate under the equity method of accounting. Concurrent with the acquisition we received additional rights
in the governance of the entity and thus we began consolidating the entity upon acquisition. As required by GAAP, we remeasured
our previously held 51% ownership in the entity, which had a recorded value of $17 million at the date of acquisition, at fair value
and recognized a gain of $68 million accordingly. This gain, which resulted in no related income tax expense, was recorded in
Other (income) expense in our 2009 Consolidated Statement of Income.
Under the equity method of accounting, we previously reported our 51% share of the net income of the unconsolidated affiliate
(after interest expense and income taxes) as Other (income) expense in the Consolidated Statements of Income. We also recorded
a franchise fee for the royalty received from the restaurants owned by the unconsolidated affiliate. Subsequent to the date of the
acquisition, we reported the results of operations for the entity in the appropriate line items of our Consolidated Statements of
Income. We no longer recorded franchise fee income for these restaurants nor did we report Other (income) expense as we did
under the equity method of accounting. Net income attributable to our partner’s ownership percentage is recorded in Net Income
– noncontrolling interests. For the year ended December 25, 2010, the consolidation of the existing restaurants upon acquisition
increased Company sales by $98 million, decreased Franchise and license fees and income by $6 million and increased Operating
Profit by $3 million versus the year ended December 26, 2009. The impact of the acquisition on Net Income – YUM! Brands,
Inc. was not significant to the year ended December 25, 2010.
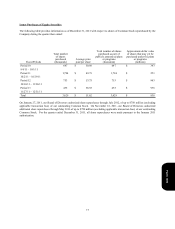
Extra Week in 2011
Our fiscal calendar results in a 53rd week every five or six years. Fiscal year 2011 included a 53rd week in the fourth quarter for
all our U.S. businesses and certain of our YRI businesses that report on a period, as opposed to a monthly, basis. Our China
Division reports on a monthly basis and thus did not have a 53rd week.
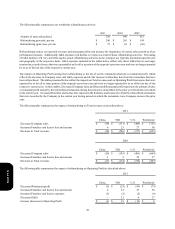
See the System Sales Growth section within our MD&A for further discussion on the impact of 53rd week on system sales. The
following table summarizes the estimated impact of the 53rd week on revenues and operating profit:
Form 10-K