Pizza Hut 2011 Annual Report Download - page 78
Download and view the complete annual report
Please find page 78 of the 2011 Pizza Hut annual report below. You can navigate through the pages in the report by either clicking on the pages listed below, or by using the keyword search tool below to find specific information within the annual report.-
 1
1 -
2
-
3
-
4
-
5
-
6
-
7
-
8
-
9
-
10
-
11
-
12
-
13
-
14
-
15
-
16
-
17
-
18
-
19
-
20
-
21
-
22
-
23
-
24
-
25
-
26
-
27
-
28
-
29
-
30
-
31
-
32
-
33
-
34
-
35
-
36
-
37
-
38
-
39
-
40
-
41
-
42
-
43
-
44
-
45
-
46
-
47
-
48
-
49
-
50
-
51
-
52
-
53
-
54
-
55
-
56
-
57
-
58
-
59
-
60
-
61
-
62
-
63
-
64
-
65
-
66
-
67
-
 68
68 -
 69
69 -
 70
70 -
 71
71 -
 72
72 -
 73
73 -
 74
74 -
 75
75 -
 76
76 -
 77
77 -
 78
78 -
 79
79 -
 80
80 -
 81
81 -
 82
82 -
 83
83 -
 84
84 -
 85
85 -
 86
86 -
 87
87 -
 88
88 -
89
-
90
-
91
-
92
-
93
-
94
-
95
-
96
-
97
-
98
-
99
-
100
-
101
-
102
-
103
-
104
-
105
-
106
-
107
-
108
-
109
-
110
-
111
-
112
-
113
-
114
-
115
-
116
-
117
-
118
-
119
-
120
-
121
-
122
-
123
-
124
-
125
-
126
-
127
-
128
-
129
-
130
-
131
-
132
-
133
-
134
-
135
-
136
-
137
-
138
-
139
-
140
-
141
-
142
-
143
-
144
-
145
-
146
-
147
-
148
-
149
-
150
-
151
-
152
-
153
-
154
-
155
-
156
-
157
-
158
-
159
-
160
-
161
-
162
-
163
-
164
-
165
-
166
-
167
-
168
-
169
-
170
-
171
-
172
-
173
-
174
-
175
-
176
-
177
-
178
-
179
-
180
-
181
-
182
-
183
-
184
-
185
-
186
-
187
-
188
-
189
-
190
-
191
-
192
-
193
-
194
-
195
-
196
-
197
-
198
-
199
-
200
-
201
-
202
-
203
-
204
-
205
-
206
-
207
-
208
-
209
-
210
-
211
-
212
 |
 |

16MAR201218540977
Proxy Statement
60
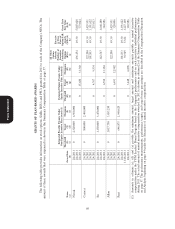
GRANTS OF PLAN-BASED AWARDS
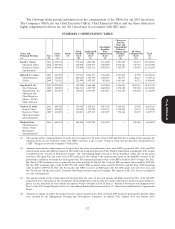
The following table provides information on stock options, SARs, RSUs and PSUs granted for 2011 to each of the Company’s NEOs. The
amount of these awards that were expensed is shown in the Summary Compensation Table at page 57.
All Other
Option
Awards; Exercise
Number of or Base
Estimated Possible Payouts Under Estimated Future Payouts Under Securities Price of
Non-Equity Incentive Plan Awards(1) Equity Incentive Plan Awards(2) Underlying Option/SAR Grant Date
Threshold Target Maximum Threshold Target Maximum Options Awards Fair Value
Name Grant Date ($) ($) ($) (#) (#) (#) (#)(3) ($/Sh)(4) ($)(5)
(a) (b) (c) (d) (e) (f) (g) (h) (j) (k) (l)
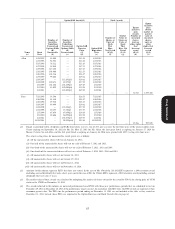
Novak 2/4/2011 0 2,320,000 6,960,000
2/4/2011 496,254 49.30 5,807,028
2/4/2011 0 15,680 31,360 773,024
Carucci 2/4/2011 0 800,000 2,400,000
2/4/2011 122,200 49.30 1,429,951
2/4/2011 101,833 49.30 1,191,622
2/4/2011 0 4,767 9,534 235,013
Su 2/4/2011 0 1,150,000 3,450,000
2/4/2011 142,567 49.30 1,668,280
2/4/2011 0 6,592 13,184 324,986
Allan 2/4/2011 0 1,017,750 3,053,250
2/4/2011 122,200 49.30 1,429,951
2/4/2011 0 6,491 12,982 320,006
Pant 2/4/2011 0 646,875 1,940,625
2/4/2011 101,833 49.30 1,191,622
11/18/2011 94,949 53.84 1,227,160
2/4/2011 0 3,448 6,896 169,986
(1) Amounts in columns (c), (d) and (e) provide the minimum amount, target amount and maximum amounts payable as annual incentive
compensation under the YUM Leaders’ Bonus Program based on the Company’s performance and on each executive’s individual performance
during 2011. The actual amount of annual incentive compensation awarded for 2011 is shown in column (f) of the Summary Compensation Table
on page 57. The performance measurements, performance targets, and target bonus percentages are described in the Compensation Discussion
and Analysis beginning on page 44 under the discussion of annual incentive compensation.