Pizza Hut 2011 Annual Report Download - page 140
Download and view the complete annual report
Please find page 140 of the 2011 Pizza Hut annual report below. You can navigate through the pages in the report by either clicking on the pages listed below, or by using the keyword search tool below to find specific information within the annual report.-
 1
1 -
2
-
3
-
4
-
5
-
6
-
7
-
8
-
9
-
10
-
11
-
12
-
13
-
14
-
15
-
16
-
17
-
18
-
19
-
20
-
21
-
22
-
23
-
24
-
25
-
26
-
27
-
28
-
29
-
30
-
31
-
32
-
33
-
34
-
35
-
36
-
37
-
38
-
39
-
40
-
41
-
42
-
43
-
44
-
45
-
46
-
47
-
48
-
49
-
50
-
51
-
52
-
53
-
54
-
55
-
56
-
57
-
58
-
59
-
60
-
61
-
62
-
63
-
64
-
65
-
66
-
67
-
68
-
69
-
70
-
71
-
72
-
73
-
74
-
75
-
76
-
77
-
78
-
79
-
80
-
81
-
82
-
83
-
84
-
85
-
86
-
87
-
88
-
89
-
90
-
91
-
92
-
93
-
94
-
95
-
96
-
97
-
98
-
99
-
100
-
101
-
102
-
103
-
104
-
105
-
106
-
107
-
108
-
109
-
110
-
111
-
112
-
113
-
114
-
115
-
116
-
117
-
118
-
119
-
120
-
121
-
122
-
123
-
124
-
125
-
126
-
127
-
128
-
129
-
 130
130 -
 131
131 -
 132
132 -
 133
133 -
 134
134 -
 135
135 -
 136
136 -
 137
137 -
 138
138 -
 139
139 -
 140
140 -
 141
141 -
 142
142 -
 143
143 -
 144
144 -
 145
145 -
 146
146 -
 147
147 -
 148
148 -
 149
149 -
 150
150 -
151
-
152
-
153
-
154
-
155
-
156
-
157
-
158
-
159
-
160
-
161
-
162
-
163
-
164
-
165
-
166
-
167
-
168
-
169
-
170
-
171
-
172
-
173
-
174
-
175
-
176
-
177
-
178
-
179
-
180
-
181
-
182
-
183
-
184
-
185
-
186
-
187
-
188
-
189
-
190
-
191
-
192
-
193
-
194
-
195
-
196
-
197
-
198
-
199
-
200
-
201
-
202
-
203
-
204
-
205
-
206
-
207
-
208
-
209
-
210
-
211
-
212
 |
 |

36
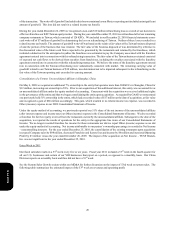
The increase in YRI G&A expenses for 2011, excluding the impact of foreign currency translation and 53rd week, was driven by
increased investment in strategic growth markets, including the acquisition of our Russia business in 2010, partially offset by
G&A savings from refranchising all of our remaining company restaurants in Mexico.
The increase in YRI G&A expenses for 2010, excluding the impact of foreign currency translation, was driven by increased
investment in strategic growth markets, including costs related to the Russia acquisition (See Note 4 for further discussion),
partially offset by G&A savings from refranchising all of our remaining company restaurants in Taiwan.
The decrease in U.S. G&A expenses for 2011, excluding the impact of 53rd week, was driven by lapping of higher litigation and
incentive compensation costs in 2010 and G&A savings from the actions taken as part of our U.S. business transformation measures.
The increase in U.S. G&A expenses for 2010 was driven by increased litigation and incentive compensation costs, partially offset
by G&A savings from the actions taken as part of our U.S. business transformation measures and lower project spending.
The increase in Unallocated G&A expenses for 2011, excluding the impact of 53rd week, was driven primarily by actions taken
as part of our U.S. business transformation measures and costs related to the LJS and A&W divestitures.
The increase in Unallocated G&A expenses for 2010 was driven by increased litigation and incentive compensation costs, partially
offset by G&A savings from the actions taken as part of our U.S. business transformation measures.
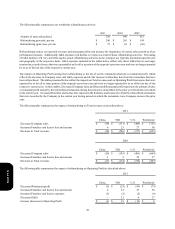
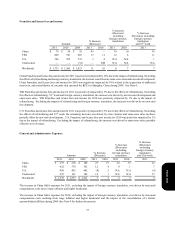
Worldwide Franchise and License Expenses
Franchise and license expenses increased 32% in 2011. The increase was driven by higher franchise-related rent expense and
depreciation (primarily at YRI), Pizza Hut U.S. franchise development incentives, higher provision for U.S. past-due receivables
(primarily at KFC) and 2011 bi-annual YRI franchise convention costs.
Franchise and license expenses decreased 7% in 2010. The decrease was driven by lower provision for U.S. past-due receivables
(primarily at KFC and Pizza Hut) and lapping 2009 international franchise convention costs.
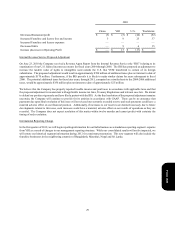
Worldwide Other (Income) Expense
Equity income from investments in unconsolidated affiliates
Gain upon consolidation of a former unconsolidated affiliate in China(a)
Foreign exchange net (gain) loss and other
Other (income) expense
2011
$(47)
—
(6)
$(53)
2010
$(42)
—
(1)
$(43)
2009
$(36)
(68)
—
$(104)
(a) See Note 4 for further discussion of the consolidation of a former unconsolidated affiliate in China.
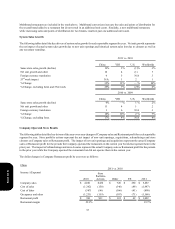
Worldwide Closure and Impairment Expenses and Refranchising (Gain) Loss
See the Store Portfolio Strategy section for more detail of our refranchising activity and Note 4 for a summary of the Closure and
impairment expenses and Refranchising (gain) loss by reportable operating segment.
Form 10-K