Pizza Hut 2011 Annual Report Download - page 61
Download and view the complete annual report
Please find page 61 of the 2011 Pizza Hut annual report below. You can navigate through the pages in the report by either clicking on the pages listed below, or by using the keyword search tool below to find specific information within the annual report.-
 1
1 -
2
-
3
-
4
-
5
-
6
-
7
-
8
-
9
-
10
-
11
-
12
-
13
-
14
-
15
-
16
-
17
-
18
-
19
-
20
-
21
-
22
-
23
-
24
-
25
-
26
-
27
-
28
-
29
-
30
-
31
-
32
-
33
-
34
-
35
-
36
-
37
-
38
-
39
-
40
-
41
-
42
-
43
-
44
-
45
-
46
-
47
-
48
-
49
-
50
-
 51
51 -
 52
52 -
 53
53 -
 54
54 -
 55
55 -
 56
56 -
 57
57 -
 58
58 -
 59
59 -
 60
60 -
 61
61 -
 62
62 -
 63
63 -
 64
64 -
 65
65 -
 66
66 -
 67
67 -
 68
68 -
 69
69 -
 70
70 -
 71
71 -
72
-
73
-
74
-
75
-
76
-
77
-
78
-
79
-
80
-
81
-
82
-
83
-
84
-
85
-
86
-
87
-
88
-
89
-
90
-
91
-
92
-
93
-
94
-
95
-
96
-
97
-
98
-
99
-
100
-
101
-
102
-
103
-
104
-
105
-
106
-
107
-
108
-
109
-
110
-
111
-
112
-
113
-
114
-
115
-
116
-
117
-
118
-
119
-
120
-
121
-
122
-
123
-
124
-
125
-
126
-
127
-
128
-
129
-
130
-
131
-
132
-
133
-
134
-
135
-
136
-
137
-
138
-
139
-
140
-
141
-
142
-
143
-
144
-
145
-
146
-
147
-
148
-
149
-
150
-
151
-
152
-
153
-
154
-
155
-
156
-
157
-
158
-
159
-
160
-
161
-
162
-
163
-
164
-
165
-
166
-
167
-
168
-
169
-
170
-
171
-
172
-
173
-
174
-
175
-
176
-
177
-
178
-
179
-
180
-
181
-
182
-
183
-
184
-
185
-
186
-
187
-
188
-
189
-
190
-
191
-
192
-
193
-
194
-
195
-
196
-
197
-
198
-
199
-
200
-
201
-
202
-
203
-
204
-
205
-
206
-
207
-
208
-
209
-
210
-
211
-
212
 |
 |

16MAR201218542623
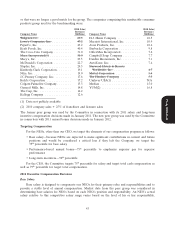
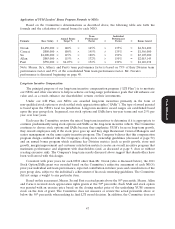
or that were no longer a good match for the group. The companies comprising this nondurable consumer
products group used for the benchmarking were:
2010 Sales/ 2010 Sales/
Revenues Revenues
Company Name ($billions) Company Name ($billions)
Walgreen Co. .................. 63.3 H.J. Heinz Company ............. 10.5
Lowe’s Companies, Inc. ........... 47.2 Marriott International, Inc. ........ 10.9
PepsiCo, Inc. .................. 43.2 Avon Products, Inc. ............. 10.4
Kraft Foods, Inc. ............... 40.4 Starbucks Corporation ............ 9.8
The Coca-Cola Company .......... 31.0 OfficeMax Incorporated ........... 7.2
Mars, Incorporated(1) ............ 30.0 Campbell Soup Company .......... 7.7
Macy’s, Inc. ................... 23.5 Darden Restaurants, Inc. .......... 7.1
McDonald’s Corporation .......... 22.7 AutoZone, Inc. ................. 7.4
Staples, Inc. ................... 24.3 Starwood Hotels & Resorts
Kimberly-Clark Corporation ........ 19.1 Worldwide, Inc. ............... 4.7
Nike, Inc. ..................... 19.0 Mattel Corporation .............. 5.4
J.C.Penney Company, Inc. ......... 17.6 The Hershey Company ........... 5.3
Kohl’s Corporation .............. 17.2 Unilever USA(1) ................ N/A
Colgate-Palmolive Company ........ 15.3 Median ....................... 15.0
General Mills, Inc. .............. 14.8 YUM(2) ...................... 16.8
The Gap, Inc. .................. 14.2
Kellogg Company ............... 12.6
(1) Data not publicly available
(2) 2010 company sales + 25% of franchisee and licensee sales
The former peer group was used by the Committee in connection with its 2011 salary and long-term
incentive compensation decisions made in January 2011. The new peer group was used by the Committee
in connection with 2011 annual bonus decisions made in January 2012.
Proxy Statement
Targeting Compensation
For the NEOs, other than our CEO, we target the elements of our compensation program as follows:
• Base salary—because NEOs are expected to make significant contributions in current and future
positions and would be considered a critical loss if they left the Company, we target the
75th percentile for base salary
• Performance-based annual bonus—75th percentile to emphasize superior pay for superior
performance
• Long-term incentives—50th percentile
For the CEO, the Committee targets 75th percentile for salary and target total cash compensation as
well as 75th percentile for target total compensation.
2011 Executive Compensation Decisions
Base Salary
Base salary is designed to compensate our NEOs for their primary roles and responsibilities and to
provide a stable level of annual compensation. Market data from the peer group was considered in
determining base salaries for NEOs based on each NEO’s position and responsibility. An NEO’s actual
salary relative to this competitive salary range varies based on the level of his or her responsibility,
43