Pizza Hut 2011 Annual Report Download - page 60
Download and view the complete annual report
Please find page 60 of the 2011 Pizza Hut annual report below. You can navigate through the pages in the report by either clicking on the pages listed below, or by using the keyword search tool below to find specific information within the annual report.-
 1
1 -
2
-
3
-
4
-
5
-
6
-
7
-
8
-
9
-
10
-
11
-
12
-
13
-
14
-
15
-
16
-
17
-
18
-
19
-
20
-
21
-
22
-
23
-
24
-
25
-
26
-
27
-
28
-
29
-
30
-
31
-
32
-
33
-
34
-
35
-
36
-
37
-
38
-
39
-
40
-
41
-
42
-
43
-
44
-
45
-
46
-
47
-
48
-
49
-
 50
50 -
 51
51 -
 52
52 -
 53
53 -
 54
54 -
 55
55 -
 56
56 -
 57
57 -
 58
58 -
 59
59 -
 60
60 -
 61
61 -
 62
62 -
 63
63 -
 64
64 -
 65
65 -
 66
66 -
 67
67 -
 68
68 -
 69
69 -
 70
70 -
71
-
72
-
73
-
74
-
75
-
76
-
77
-
78
-
79
-
80
-
81
-
82
-
83
-
84
-
85
-
86
-
87
-
88
-
89
-
90
-
91
-
92
-
93
-
94
-
95
-
96
-
97
-
98
-
99
-
100
-
101
-
102
-
103
-
104
-
105
-
106
-
107
-
108
-
109
-
110
-
111
-
112
-
113
-
114
-
115
-
116
-
117
-
118
-
119
-
120
-
121
-
122
-
123
-
124
-
125
-
126
-
127
-
128
-
129
-
130
-
131
-
132
-
133
-
134
-
135
-
136
-
137
-
138
-
139
-
140
-
141
-
142
-
143
-
144
-
145
-
146
-
147
-
148
-
149
-
150
-
151
-
152
-
153
-
154
-
155
-
156
-
157
-
158
-
159
-
160
-
161
-
162
-
163
-
164
-
165
-
166
-
167
-
168
-
169
-
170
-
171
-
172
-
173
-
174
-
175
-
176
-
177
-
178
-
179
-
180
-
181
-
182
-
183
-
184
-
185
-
186
-
187
-
188
-
189
-
190
-
191
-
192
-
193
-
194
-
195
-
196
-
197
-
198
-
199
-
200
-
201
-
202
-
203
-
204
-
205
-
206
-
207
-
208
-
209
-
210
-
211
-
212
 |
 |

16MAR201218540977
Comparative Compensation Data
Revenue size often correlates to some degree with the market value of compensation for senior
executive positions. For companies with significant franchise operations, measuring size is a more complex
undertaking. This is because there are added complexities and responsibilities for managing the
relationships, arrangements, and overall scope of the enterprise that franchising introduces, in particular,
managing product introductions, marketing, driving new unit development, customer satisfaction and
overall operations improvements across the entire franchise system. Accordingly, consistent with its
practice from prior years which Meridian had recommended, the Committee decided to add 25% of
estimated franchisee and licensee sales to the Company’s estimated 2010 sales to establish an appropriate
revenue benchmark to determine the market value of various components of compensation for 2011. This
means that the Company, when considering franchisee sales, is viewed as having estimated revenues of
$16.8 billion. Specifically, this amount was determined by adding 2010 estimated Company sales of
$9.8 billion and 25% of estimated franchisee and licensee sales (from which the Company derives revenues
in the form of royalties) of $28 billion.
The median annual revenues (for 2010, the most recent year available at that time) for the peer group
established by the Committee was $15 billion. Data for each individual job using the methodology
described in the previous paragraph was compiled based on the estimated revenue size of the division that
the NEO was responsible for in 2010, specifically $16.8 billion for Messrs. Novak and Carucci, $4.3 billion
for Mr. Su and $5.5 billion for Messrs. Allan and Pant.
Companies included in the Peer Group
The peer group for all NEOs is made up of retail, hospitality and nondurable consumer product
companies. The Committee established this peer group for the CEO and other NEO compensation in
2008. The group was chosen because it is reflective of the market in which we operate for executive talent
and because of each of the companys’ relative leadership position in their sector, relative size as measured
by revenues, relative complexity of their business, and in some cases their global reach. Periodically the
Committee, with Meridian’s assistance, reviews the composition of the peer group to ensure the companies
remain relevant for comparative purposes.
Proxy Statement
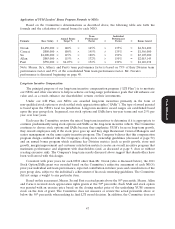
As a result of the Committee’s review in March 2011, four new companies (H.J. Heinz, Nike,
Starbucks and Unilever USA) were added and six companies were removed from the peer group, as shown
below. Although the Committee prefers to keep the peer group substantially the same from year to year,
the companies deleted from the peer group represented companies whose data was not as readily available
42