Pizza Hut 2011 Annual Report Download - page 184
Download and view the complete annual report
Please find page 184 of the 2011 Pizza Hut annual report below. You can navigate through the pages in the report by either clicking on the pages listed below, or by using the keyword search tool below to find specific information within the annual report.-
 1
1 -
2
-
3
-
4
-
5
-
6
-
7
-
8
-
9
-
10
-
11
-
12
-
13
-
14
-
15
-
16
-
17
-
18
-
19
-
20
-
21
-
22
-
23
-
24
-
25
-
26
-
27
-
28
-
29
-
30
-
31
-
32
-
33
-
34
-
35
-
36
-
37
-
38
-
39
-
40
-
41
-
42
-
43
-
44
-
45
-
46
-
47
-
48
-
49
-
50
-
51
-
52
-
53
-
54
-
55
-
56
-
57
-
58
-
59
-
60
-
61
-
62
-
63
-
64
-
65
-
66
-
67
-
68
-
69
-
70
-
71
-
72
-
73
-
74
-
75
-
76
-
77
-
78
-
79
-
80
-
81
-
82
-
83
-
84
-
85
-
86
-
87
-
88
-
89
-
90
-
91
-
92
-
93
-
94
-
95
-
96
-
97
-
98
-
99
-
100
-
101
-
102
-
103
-
104
-
105
-
106
-
107
-
108
-
109
-
110
-
111
-
112
-
113
-
114
-
115
-
116
-
117
-
118
-
119
-
120
-
121
-
122
-
123
-
124
-
125
-
126
-
127
-
128
-
129
-
130
-
131
-
132
-
133
-
134
-
135
-
136
-
137
-
138
-
139
-
140
-
141
-
142
-
143
-
144
-
145
-
146
-
147
-
148
-
149
-
150
-
151
-
152
-
153
-
154
-
155
-
156
-
157
-
158
-
159
-
160
-
161
-
162
-
163
-
164
-
165
-
166
-
167
-
168
-
169
-
170
-
171
-
172
-
173
-
 174
174 -
 175
175 -
 176
176 -
 177
177 -
 178
178 -
 179
179 -
 180
180 -
 181
181 -
 182
182 -
 183
183 -
 184
184 -
 185
185 -
 186
186 -
 187
187 -
 188
188 -
 189
189 -
 190
190 -
 191
191 -
 192
192 -
 193
193 -
 194
194 -
195
-
196
-
197
-
198
-
199
-
200
-
201
-
202
-
203
-
204
-
205
-
206
-
207
-
208
-
209
-
210
-
211
-
212
 |
 |

80
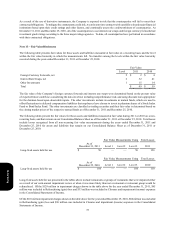
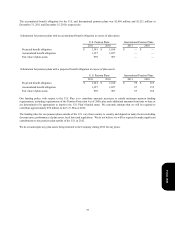
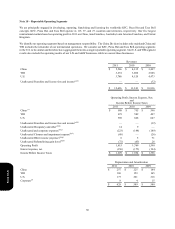
We believe it is appropriate to group our stock option and SAR awards into two homogeneous groups when estimating expected
term. These groups consist of grants made primarily to restaurant-level employees under the RGM Plan, which cliff-vest after
four years and expire ten years after grant, and grants made to executives under our other stock award plans, which typically have
a graded vesting schedule of 25% per year over four years and expire ten years after grant. We use a single weighted-average
term for our awards that have a graded vesting schedule. Based on analysis of our historical exercise and post-vesting termination
behavior, we have determined that our restaurant-level employees and our executives exercised the awards on average after five
years and six years, respectively.
When determining expected volatility, we consider both historical volatility of our stock as well as implied volatility associated
with our traded options. The expected dividend yield is based on the annual dividend yield at the time of grant.
The fair values of RSU and PSU awards are based on the closing price of our stock on the date of grant.
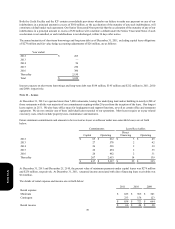
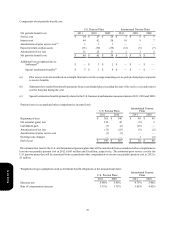
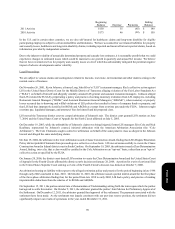
Award Activity
Stock Options and SARs
Outstanding at the beginning of the year
Granted
Exercised
Forfeited or expired
Outstanding at the end of the year
Exercisable at the end of the year
Shares
(in thousands)
36,438
5,023
(6,645)
(1,308)
33,508
18,709
(a)
Weighted-Average
Exercise
Price
$ 26.91
49.59
20.33
35.52
$ 31.28
$ 26.00
Weighted- Average
Remaining
Contractual Term
5.96
4.48
Aggregate
Intrinsic Value
(in millions)
$ 929
$ 618
(a) Outstanding awards include 8,161 options and 25,347 SARs with average exercise prices of $21.56 and $34.41,
respectively.
The weighted-average grant-date fair value of stock options and SARs granted during 2011, 2010 and 2009 was $11.78, $8.21
and $7.29, respectively. The total intrinsic value of stock options and SARs exercised during the years ended December 31, 2011,
December 25, 2010 and December 26, 2009, was $226 million, $259 million and $217 million, respectively.
As of December 31, 2011, there was $82 million of unrecognized compensation cost related to stock options and SARs, which
will be reduced by any forfeitures that occur, related to unvested awards that is expected to be recognized over a remaining
weighted-average period of approximately 2.5 years. The total fair value at grant date of awards vested during 2011, 2010 and
2009 was $43 million, $47 million and $52 million, respectively.
RSUs and PSUs
As of December 31, 2011, there was $10 million of unrecognized compensation cost related to 1.0 million unvested RSUs and
PSUs.
Form 10-K