Pizza Hut 2011 Annual Report Download - page 172
Download and view the complete annual report
Please find page 172 of the 2011 Pizza Hut annual report below. You can navigate through the pages in the report by either clicking on the pages listed below, or by using the keyword search tool below to find specific information within the annual report.-
 1
1 -
2
-
3
-
4
-
5
-
6
-
7
-
8
-
9
-
10
-
11
-
12
-
13
-
14
-
15
-
16
-
17
-
18
-
19
-
20
-
21
-
22
-
23
-
24
-
25
-
26
-
27
-
28
-
29
-
30
-
31
-
32
-
33
-
34
-
35
-
36
-
37
-
38
-
39
-
40
-
41
-
42
-
43
-
44
-
45
-
46
-
47
-
48
-
49
-
50
-
51
-
52
-
53
-
54
-
55
-
56
-
57
-
58
-
59
-
60
-
61
-
62
-
63
-
64
-
65
-
66
-
67
-
68
-
69
-
70
-
71
-
72
-
73
-
74
-
75
-
76
-
77
-
78
-
79
-
80
-
81
-
82
-
83
-
84
-
85
-
86
-
87
-
88
-
89
-
90
-
91
-
92
-
93
-
94
-
95
-
96
-
97
-
98
-
99
-
100
-
101
-
102
-
103
-
104
-
105
-
106
-
107
-
108
-
109
-
110
-
111
-
112
-
113
-
114
-
115
-
116
-
117
-
118
-
119
-
120
-
121
-
122
-
123
-
124
-
125
-
126
-
127
-
128
-
129
-
130
-
131
-
132
-
133
-
134
-
135
-
136
-
137
-
138
-
139
-
140
-
141
-
142
-
143
-
144
-
145
-
146
-
147
-
148
-
149
-
150
-
151
-
152
-
153
-
154
-
155
-
156
-
157
-
158
-
159
-
160
-
161
-
 162
162 -
 163
163 -
 164
164 -
 165
165 -
 166
166 -
 167
167 -
 168
168 -
 169
169 -
 170
170 -
 171
171 -
 172
172 -
 173
173 -
 174
174 -
 175
175 -
 176
176 -
 177
177 -
 178
178 -
 179
179 -
 180
180 -
 181
181 -
 182
182 -
183
-
184
-
185
-
186
-
187
-
188
-
189
-
190
-
191
-
192
-
193
-
194
-
195
-
196
-
197
-
198
-
199
-
200
-
201
-
202
-
203
-
204
-
205
-
206
-
207
-
208
-
209
-
210
-
211
-
212
 |
 |

68
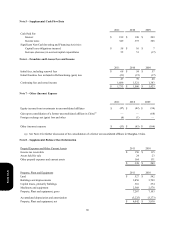
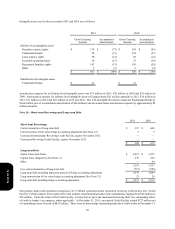
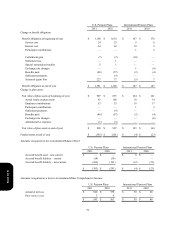
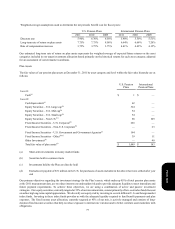
Intangible assets, net for the years ended 2011 and 2010 are as follows:
Definite-lived intangible assets
Franchise contract rights
Trademarks/brands
Lease tenancy rights
Favorable operating leases
Reacquired franchise rights
Other
Indefinite-lived intangible assets
Trademarks/brands
2011
Gross Carrying
Amount
$ 130
28
58
29
167
5
$ 417
$ 31
Accumulated
Amortization
$(77)
(12)
(12)
(13)
(33)
(2)
$(149)
2010
Gross Carrying
Amount
$ 163
234
56
27
143
5
$ 628
$ 31
Accumulated
Amortization
$(83)
(57)
(12)
(10)
(20)
(2)
$(184)
Amortization expense for all definite-lived intangible assets was $31 million in 2011, $29 million in 2010 and $25 million in
2009. Amortization expense for definite-lived intangible assets will approximate $21 million annually in 2012, $19 million in
2013, $17 million in 2014 and $16 million in 2015 and 2016. The LJS and A&W divestitures impacted Trademarks/brands by
$164 million (net of accumulation amortization of $48 million) and decreased future amortization expense by approximately $8
million annually.
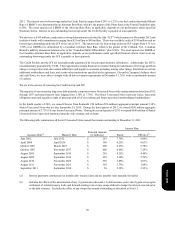
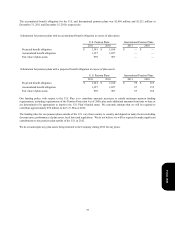
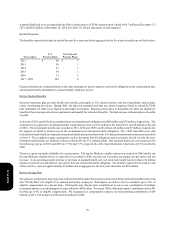
Note 10 – Short-term Borrowings and Long-term Debt
Short-term Borrowings
Current maturities of long-term debt
Current portion of fair value hedge accounting adjustment (See Note 12)
Unsecured International Revolving Credit Facility, expires November 2012
Unsecured Revolving Credit Facility, expires November 2012
Long-term Debt
Senior Unsecured Notes
Capital lease obligations (See Note 11)
Other
Less current maturities of long-term debt
Long-term debt excluding long-term portion of hedge accounting adjustment
Long-term portion of fair value hedge accounting adjustment (See Note 12)
Long-term debt including hedge accounting adjustment
2011
$ 315
5
—
—
$ 320
$ 3,012
279
—
3,291
(315)
2,976
21
$ 2,997
2010
$ 668
5
—
—
$ 673
$ 3,257
236
64
3,557
(668)
2,889
26
$ 2,915
Our primary bank credit agreement comprises a $1.15 billion syndicated senior unsecured revolving credit facility (the “Credit
Facility”) which matures in November 2012 and includes 24 participating banks with commitments ranging from $20 million to
$93 million. Under the terms of the Credit Facility, we may borrow up to the maximum borrowing limit, less outstanding letters
of credit or banker’s acceptances, where applicable. At December 31, 2011, our unused Credit Facility totaled $727 million net
of outstanding letters of credit of $423 million. There were no borrowings outstanding under the Credit Facility at December 31,
Form 10-K