Pizza Hut 2011 Annual Report Download - page 64
Download and view the complete annual report
Please find page 64 of the 2011 Pizza Hut annual report below. You can navigate through the pages in the report by either clicking on the pages listed below, or by using the keyword search tool below to find specific information within the annual report.-
 1
1 -
2
-
3
-
4
-
5
-
6
-
7
-
8
-
9
-
10
-
11
-
12
-
13
-
14
-
15
-
16
-
17
-
18
-
19
-
20
-
21
-
22
-
23
-
24
-
25
-
26
-
27
-
28
-
29
-
30
-
31
-
32
-
33
-
34
-
35
-
36
-
37
-
38
-
39
-
40
-
41
-
42
-
43
-
44
-
45
-
46
-
47
-
48
-
49
-
50
-
51
-
52
-
53
-
 54
54 -
 55
55 -
 56
56 -
 57
57 -
 58
58 -
 59
59 -
 60
60 -
 61
61 -
 62
62 -
 63
63 -
 64
64 -
 65
65 -
 66
66 -
 67
67 -
 68
68 -
 69
69 -
 70
70 -
 71
71 -
 72
72 -
 73
73 -
 74
74 -
75
-
76
-
77
-
78
-
79
-
80
-
81
-
82
-
83
-
84
-
85
-
86
-
87
-
88
-
89
-
90
-
91
-
92
-
93
-
94
-
95
-
96
-
97
-
98
-
99
-
100
-
101
-
102
-
103
-
104
-
105
-
106
-
107
-
108
-
109
-
110
-
111
-
112
-
113
-
114
-
115
-
116
-
117
-
118
-
119
-
120
-
121
-
122
-
123
-
124
-
125
-
126
-
127
-
128
-
129
-
130
-
131
-
132
-
133
-
134
-
135
-
136
-
137
-
138
-
139
-
140
-
141
-
142
-
143
-
144
-
145
-
146
-
147
-
148
-
149
-
150
-
151
-
152
-
153
-
154
-
155
-
156
-
157
-
158
-
159
-
160
-
161
-
162
-
163
-
164
-
165
-
166
-
167
-
168
-
169
-
170
-
171
-
172
-
173
-
174
-
175
-
176
-
177
-
178
-
179
-
180
-
181
-
182
-
183
-
184
-
185
-
186
-
187
-
188
-
189
-
190
-
191
-
192
-
193
-
194
-
195
-
196
-
197
-
198
-
199
-
200
-
201
-
202
-
203
-
204
-
205
-
206
-
207
-
208
-
209
-
210
-
211
-
212
 |
 |

16MAR201218540977
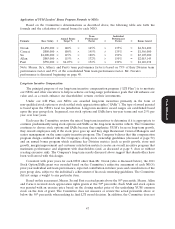
2011 YUM Leaders’ Bonus Program Team Performance (TP) Factor Calculation
TP Factor
TP based After
on leverage Applying
NEO TP Measures TP Target TP Actual formula TP Weight Weights
Novak and Carucci Weighted Average Divisions’ Team Factors(1) 129 50% 65
EPS Growth 10% 14% 160 50% 80
Total Weighted TP Factor—Yum 145
Su Operating Profit Growth (Before Tax; Excluding
Forex) 10% 15% 185 50% 93
System Sales Growth (Excluding Forex) 11% 29.3% 200 20% 40
System Gross New Builds 465 656 200 20% 40
System Customer Satisfaction 100 195 195 10% 19
Total Weighted TP Factor—China Division 192
75% Division/25% Yum TP Factor 180
Allan and Pant Operating Profit Growth (Before Tax; Excluding
Forex) 10% 9.6% 95 50% 47
System Sales Growth (Excluding Forex) 5% 6.7% 169 20% 34
System Net Builds 414 504 190 20% 38
System Customer Satisfaction Blended Blended 92 10% 9
Total Weighted TP Factor—YRI Division 128
75% Division/25% Yum TP Factor 132
(1) Weighted average based on Divisions’ contribution to overall operating profit of Yum in 2011.
Division operating profit growth is based on actual year-over-year growth and is adjusted to exclude
the impact of any foreign currency translation. In the case of system sales growth, we include the results of
all restaurants, including Company-owned, franchised and licensed restaurants and it is based on year-
over-year growth and adjusted to exclude the impact of any foreign currency translation and, in the case of
YRI, the impact of a 53rd week in their 2011 reporting calendar.
Proxy Statement
Individual Performance Factor. Each NEO’s Individual Performance Factor is determined by the
Committee based upon their subjective determination of the NEO’s individual performance for the year,
including consideration of specific objective individual performance goals set at the beginning of the year.
As described above, the CEO provides the Committee with his evaluation of each of the other NEOs’
performance and recommends an Individual Performance Factor to the Committee.
For Mr. Carucci, the Committee determined that his overall individual performance for 2011 was
above target based upon overall strong financial results of the Company, and success in helping drive
emerging market growth. Based on this performance, the Committee approved a 135 Individual
Performance Factor for Mr. Carucci.
For Mr. Su, the Committee determined that his overall individual performance for 2011 was
significantly above target based upon the China Division significantly exceeding its profit, sales growth,
development and customer satisfaction plans. Based on this performance, the Committee approved a 150
Individual Performance Factor for Mr. Su.
For Mr. Allan, the Committee determined that his overall individual performance for 2011 was
significantly above target based upon YRI’s sales growth, continued strong restaurant development, and
accelerated growth in strategic markets. Based on this performance, the Committee approved a 150
Individual Performance Factor for Mr. Allan.
For Mr. Pant, the Committee determined that his overall individual performance for 2011 was above
target based upon YRI’s significant progress in driving brand differentiation including the development of
KFC global brand marketing and the expansion of KFC sales layers. Based on this performance, the
Committee approved a 130 Individual Performance Factor for Mr. Pant.
46