Pizza Hut 2011 Annual Report Download - page 139
Download and view the complete annual report
Please find page 139 of the 2011 Pizza Hut annual report below. You can navigate through the pages in the report by either clicking on the pages listed below, or by using the keyword search tool below to find specific information within the annual report.
35
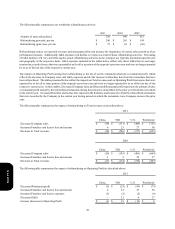
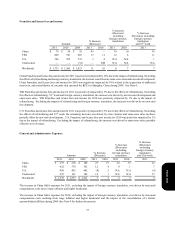
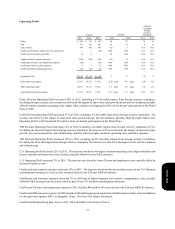
Franchise and license fees and income
China
YRI
U.S.
Unallocated
Worldwide
Amount
2011
$ 79
868
786
—
$ 1,733
2010
$ 54
741
765
—
$ 1,560
2009
$ 55
665
735
(32)
$ 1,423
% Increase
(Decrease)
2011
45
17
3
—
11
2010
—
11
4
NM
10
% Increase
(Decrease)
excluding
foreign currency
translation
2011
38
12
N/A
N/A
8
2010
(1)
6
N/A
N/A
7
% Increase
(Decrease) excluding
foreign currency
translation
and 53rd week
2011
38
11
1
N/A
7
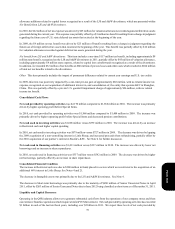
China Franchise and license fees and income for 2011 was positively impacted by 12% due to the impact of refranchising. Excluding
the effects of refranchising and foreign currency translation, the increase was driven by same-store sales and new unit development.
China Franchise and license fees and income for 2010 was negatively impacted by 10% related to the acquisition of additional
interest in, and consolidation of, an entity that operated the KFCs in Shanghai, China during 2009. See Note 4.
YRI Franchise and license fees and income for 2011 was positively impacted by 3% due to the effects of refranchising. Excluding
the effects of refranchising, 53rd week and foreign currency translation, the increase was driven by net new unit development and
same-store sales. YRI Franchise and license fees and income for 2010 was positively impacted by 1% due to the impact of
refranchising. Excluding the impacts of refranchising and foreign currency translation, the increase was driven by net new unit
development.
U.S. Franchise and license fees and income for 2011 was positively impacted by 3% due to the effects of refranchising. Excluding
the effects of refranchising and 53rd week, the remaining decrease was driven by store closures and same-store sales declines,
partially offset by new unit development. U.S. Franchise and license fees and income for 2010 was positively impacted by 3%
due to the impact of refranchising. Excluding the impact of refranchising, the increase was driven by same-store sales, partially
offset by store closures.
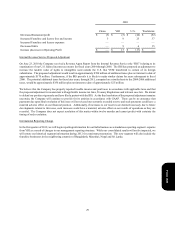
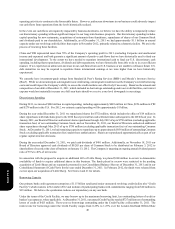
General and Administrative Expenses
China
YRI
U.S.
Unallocated
Worldwide
Amount
2011
$ 275
422
450
225
$ 1,372
2010
$ 216
378
492
191
$ 1,277
2009
$ 188
362
482
189
$ 1,221
% Increase
(Decrease)
2011
27
12
(8)
18
7
2010
15
4
2
1
5
% Increase
(Decrease)
excluding
foreign currency
translation
2011
22
8
N/A
N/A
5
2010
15
1
N/A
N/A
3
% Increase
(Decrease)
excluding
foreign currency
translation
and 53rd week
2011
22
7
(9)
17
5
The increase in China G&A expenses for 2011, excluding the impact of foreign currency translation, was driven by increased
compensation costs due to wage inflation and higher headcount.
The increase in China G&A expenses for 2010, excluding the impact of foreign currency translation, was driven by increased
compensation costs resulting from wage inflation and higher headcount and the impact of the consolidation of a former
unconsolidated affiliate during 2009 (See Note 4 for further discussion).
Form 10-K


