Pizza Hut 2011 Annual Report Download - page 166
Download and view the complete annual report
Please find page 166 of the 2011 Pizza Hut annual report below. You can navigate through the pages in the report by either clicking on the pages listed below, or by using the keyword search tool below to find specific information within the annual report.-
 1
1 -
2
-
3
-
4
-
5
-
6
-
7
-
8
-
9
-
10
-
11
-
12
-
13
-
14
-
15
-
16
-
17
-
18
-
19
-
20
-
21
-
22
-
23
-
24
-
25
-
26
-
27
-
28
-
29
-
30
-
31
-
32
-
33
-
34
-
35
-
36
-
37
-
38
-
39
-
40
-
41
-
42
-
43
-
44
-
45
-
46
-
47
-
48
-
49
-
50
-
51
-
52
-
53
-
54
-
55
-
56
-
57
-
58
-
59
-
60
-
61
-
62
-
63
-
64
-
65
-
66
-
67
-
68
-
69
-
70
-
71
-
72
-
73
-
74
-
75
-
76
-
77
-
78
-
79
-
80
-
81
-
82
-
83
-
84
-
85
-
86
-
87
-
88
-
89
-
90
-
91
-
92
-
93
-
94
-
95
-
96
-
97
-
98
-
99
-
100
-
101
-
102
-
103
-
104
-
105
-
106
-
107
-
108
-
109
-
110
-
111
-
112
-
113
-
114
-
115
-
116
-
117
-
118
-
119
-
120
-
121
-
122
-
123
-
124
-
125
-
126
-
127
-
128
-
129
-
130
-
131
-
132
-
133
-
134
-
135
-
136
-
137
-
138
-
139
-
140
-
141
-
142
-
143
-
144
-
145
-
146
-
147
-
148
-
149
-
150
-
151
-
152
-
153
-
154
-
155
-
 156
156 -
 157
157 -
 158
158 -
 159
159 -
 160
160 -
 161
161 -
 162
162 -
 163
163 -
 164
164 -
 165
165 -
 166
166 -
 167
167 -
 168
168 -
 169
169 -
 170
170 -
 171
171 -
 172
172 -
 173
173 -
 174
174 -
 175
175 -
 176
176 -
177
-
178
-
179
-
180
-
181
-
182
-
183
-
184
-
185
-
186
-
187
-
188
-
189
-
190
-
191
-
192
-
193
-
194
-
195
-
196
-
197
-
198
-
199
-
200
-
201
-
202
-
203
-
204
-
205
-
206
-
207
-
208
-
209
-
210
-
211
-
212
 |
 |

62
As a result of a decline in future profit expectations for our LJS and A&W U.S. businesses due in part to the impact of a reduced
emphasis on multi-branding, we recorded a non-cash charge of $26 million, which resulted in no related income tax benefit, in
the fourth quarter of 2009 to write-off goodwill associated with our LJS and A&W U.S. businesses we owned at the time.
We are not including the impacts of these U.S. business transformation measures in our U.S. segment for performance reporting
purposes as we do not believe they are indicative of our ongoing operations. Additionally, we are not including the depreciation
reduction of $10 million and $9 million for the years ended December 31, 2011 and December 25, 2010, respectively, arising from
the impairment of the KFCs offered for sale in the year ended December 25, 2010 within our U.S. segment for performance
reporting purposes. Rather, we are recording such reduction as a credit within unallocated Occupancy and other operating expenses
resulting in depreciation expense for the impaired restaurants we continue to own being recorded in the U.S. segment at the rate
at which it was prior to the impairment charge being recorded.
LJS and A&W Divestitures
During the fourth quarter of 2011 we sold the Long John Silver's and A&W All American Food Restaurants brands to key franchise
leaders and strategic investors in separate transactions.
We recognized $86 million of pre-tax losses and other costs primarily in Closures and impairment (income) expenses during 2011
as a result of these transactions. Additionally, we recognized $104 million of tax benefits related to tax losses associated with the
transactions.
We are not including the pre-tax losses and other costs in our U.S. and YRI segments for performance reporting purposes as we
do not believe they are indicative of our ongoing operations. In 2011, these businesses contributed 5% and 1% to Franchise and
license fees and income for the U.S. and YRI segments, respectively. While these businesses contributed 1% to both the U.S. and
YRI segments' Operating Profit in 2011, the impact on our consolidated Operating Profit was not significant.
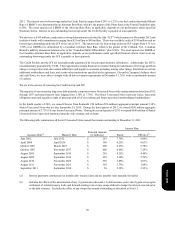
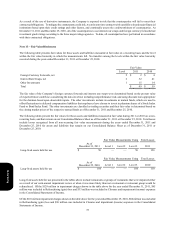
Consolidation of a Former Unconsolidated Affiliate in Shanghai, China
On May 4, 2009 we acquired an additional 7% ownership in the entity that operates more than 200 KFCs in Shanghai, China for
$12 million, increasing our ownership to 58%. The acquisition was driven by our desire to increase our management control over
the entity and further integrate the business with the remainder of our KFC operations in China. Prior to our acquisition of this
additional interest, this entity was accounted for as an unconsolidated affiliate under the equity method of accounting due to the
effective participation of our partners in the significant decisions of the entity that were made in the ordinary course of
business. Concurrent with the acquisition we received additional rights in the governance of the entity, and thus we began
consolidating the entity upon acquisition. As required by GAAP, we remeasured our previously held 51% ownership in the entity,
which had a recorded value of $17 million at the date of acquisition, at fair value and recognized a gain of $68 million
accordingly. This gain, which resulted in no related income tax expense, was recorded in Other (income) expense on our
Consolidated Statement of Income during 2009 and was not allocated to any segment for performance reporting purposes.
Under the equity method of accounting, we previously reported our 51% share of the net income of the unconsolidated affiliate
(after interest expense and income taxes) as Other (income) expense in the Consolidated Statements of Income. We also recorded
a franchise fee for the royalty received from the stores owned by the unconsolidated affiliate. From the date of the acquisition, we
have reported the results of operations for the entity in the appropriate line items of our Consolidated Statements of Income. We
no longer recorded franchise fee income for these restaurants nor did we report Other (income) expense as we did under the equity
method of accounting. Net income attributable to our partner’s ownership percentage is recorded in Net Income – noncontrolling
interests. For the year ended December 25, 2010, the consolidation of the existing restaurants upon acquisition increased Company
sales by $98 million, decreased Franchise and license fees and income by $6 million and increased Operating Profit by $3 million
versus the year ended December 26, 2009. The impact of the acquisition on Net Income – YUM! Brands, Inc. was not significant
to the year ended December 25, 2010.
The pro forma impact on our results of operations if the acquisition had been completed as of the beginning of 2009 would not
have been significant.
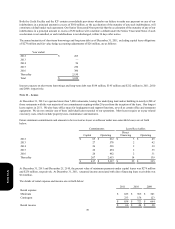
Little Sheep Initial Investment and Pending Acquisition
During 2009, our China Division paid approximately $103 million, in several tranches, to purchase 27% of the outstanding common
shares of Little Sheep and obtain Board of Directors representation. We began reporting our investment in Little Sheep using the
equity method of accounting, and this investment is included in Investments in unconsolidated affiliates on our Consolidated
Form 10-K