Pizza Hut 2011 Annual Report Download - page 134
Download and view the complete annual report
Please find page 134 of the 2011 Pizza Hut annual report below. You can navigate through the pages in the report by either clicking on the pages listed below, or by using the keyword search tool below to find specific information within the annual report.-
 1
1 -
2
-
3
-
4
-
5
-
6
-
7
-
8
-
9
-
10
-
11
-
12
-
13
-
14
-
15
-
16
-
17
-
18
-
19
-
20
-
21
-
22
-
23
-
24
-
25
-
26
-
27
-
28
-
29
-
30
-
31
-
32
-
33
-
34
-
35
-
36
-
37
-
38
-
39
-
40
-
41
-
42
-
43
-
44
-
45
-
46
-
47
-
48
-
49
-
50
-
51
-
52
-
53
-
54
-
55
-
56
-
57
-
58
-
59
-
60
-
61
-
62
-
63
-
64
-
65
-
66
-
67
-
68
-
69
-
70
-
71
-
72
-
73
-
74
-
75
-
76
-
77
-
78
-
79
-
80
-
81
-
82
-
83
-
84
-
85
-
86
-
87
-
88
-
89
-
90
-
91
-
92
-
93
-
94
-
95
-
96
-
97
-
98
-
99
-
100
-
101
-
102
-
103
-
104
-
105
-
106
-
107
-
108
-
109
-
110
-
111
-
112
-
113
-
114
-
115
-
116
-
117
-
118
-
119
-
120
-
121
-
122
-
123
-
 124
124 -
 125
125 -
 126
126 -
 127
127 -
 128
128 -
 129
129 -
 130
130 -
 131
131 -
 132
132 -
 133
133 -
 134
134 -
 135
135 -
 136
136 -
 137
137 -
 138
138 -
 139
139 -
 140
140 -
 141
141 -
 142
142 -
 143
143 -
 144
144 -
145
-
146
-
147
-
148
-
149
-
150
-
151
-
152
-
153
-
154
-
155
-
156
-
157
-
158
-
159
-
160
-
161
-
162
-
163
-
164
-
165
-
166
-
167
-
168
-
169
-
170
-
171
-
172
-
173
-
174
-
175
-
176
-
177
-
178
-
179
-
180
-
181
-
182
-
183
-
184
-
185
-
186
-
187
-
188
-
189
-
190
-
191
-
192
-
193
-
194
-
195
-
196
-
197
-
198
-
199
-
200
-
201
-
202
-
203
-
204
-
205
-
206
-
207
-
208
-
209
-
210
-
211
-
212
 |
 |

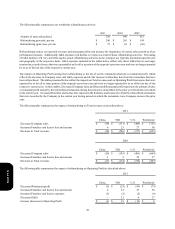
30
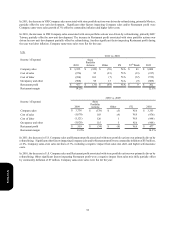
Restaurant Unit Activity
Worldwide
Balance at end of 2009
New Builds
Acquisitions
Refranchising
Closures
Other
Balance at end of 2010
New Builds
Acquisitions
Refranchising
Closures
LJS & A&W Divestitures(b)
Other
Balance at end of 2011
% of Total
Franchisees
26,745
952
(110)
949
(668)
(16)
27,852
1,058
(137)
529
(743)
(1,633)
2
26,928
77%
Company
7,666
607
110
(949)
(163)
—
7,271
749
137
(529)
(191)
—
—
7,437
21%
Unconsolidated
Affiliates
469
62
—
—
(6)
—
525
73
—
—
(11)
—
—
587
2%
Total Excluding
Licensees(a)
34,880
1,621
—
—
(837)
(16)
35,648
1,880
—
—
(945)
(1,633)
2
34,952
100%
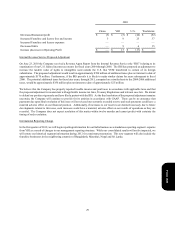
China
Balance at end of 2009
New Builds
Acquisitions
Refranchising
Closures
Other
Balance at end of 2010
New Builds
Acquisitions
Refranchising
Closures
Other
Balance at end of 2011
% of Total
Franchisees
118
3
—
33
(1)
—
153
4
—
47
(3)
—
201
4%
Company
2,866
442
—
(33)
(47)
—
3,228
579
—
(47)
(55)
—
3,705
83%
Unconsolidated
Affiliates
469
62
—
—
(6)
—
525
73
—
—
(11)
—
587
13%
Total Excluding
Licensees(a)
3,453
507
—
—
(54)
—
3,906
656
—
—
(69)
—
4,493
100%
Form 10-K