Pizza Hut 2011 Annual Report Download - page 2
Download and view the complete annual report
Please find page 2 of the 2011 Pizza Hut annual report below. You can navigate through the pages in the report by either clicking on the pages listed below, or by using the keyword search tool below to find specific information within the annual report.-
 1
1 -
 2
2 -
 3
3 -
 4
4 -
 5
5 -
 6
6 -
 7
7 -
 8
8 -
 9
9 -
 10
10 -
 11
11 -
 12
12 -
 13
13 -
14
-
15
-
16
-
17
-
18
-
19
-
20
-
21
-
22
-
23
-
24
-
25
-
26
-
27
-
28
-
29
-
30
-
31
-
32
-
33
-
34
-
35
-
36
-
37
-
38
-
39
-
40
-
41
-
42
-
43
-
44
-
45
-
46
-
47
-
48
-
49
-
50
-
51
-
52
-
53
-
54
-
55
-
56
-
57
-
58
-
59
-
60
-
61
-
62
-
63
-
64
-
65
-
66
-
67
-
68
-
69
-
70
-
71
-
72
-
73
-
74
-
75
-
76
-
77
-
78
-
79
-
80
-
81
-
82
-
83
-
84
-
85
-
86
-
87
-
88
-
89
-
90
-
91
-
92
-
93
-
94
-
95
-
96
-
97
-
98
-
99
-
100
-
101
-
102
-
103
-
104
-
105
-
106
-
107
-
108
-
109
-
110
-
111
-
112
-
113
-
114
-
115
-
116
-
117
-
118
-
119
-
120
-
121
-
122
-
123
-
124
-
125
-
126
-
127
-
128
-
129
-
130
-
131
-
132
-
133
-
134
-
135
-
136
-
137
-
138
-
139
-
140
-
141
-
142
-
143
-
144
-
145
-
146
-
147
-
148
-
149
-
150
-
151
-
152
-
153
-
154
-
155
-
156
-
157
-
158
-
159
-
160
-
161
-
162
-
163
-
164
-
165
-
166
-
167
-
168
-
169
-
170
-
171
-
172
-
173
-
174
-
175
-
176
-
177
-
178
-
179
-
180
-
181
-
182
-
183
-
184
-
185
-
186
-
187
-
188
-
189
-
190
-
191
-
192
-
193
-
194
-
195
-
196
-
197
-
198
-
199
-
200
-
201
-
202
-
203
-
204
-
205
-
206
-
207
-
208
-
209
-
210
-
211
-
212
 |
 |

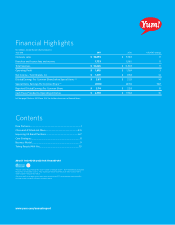
Financial Highlights
(In millions, except for per share amounts)
Year-end 2011 2010 % B/(W) change
Company sales $ 10,893 $ 9,783 11
Franchise and license fees and income 1,733 1,560 11
Total revenues $ 12,626 $ 11,343 11
Operating Profit $ 1,815 $ 1,769 3
Net Income – Yum! Brands, Inc. $ 1,319 $ 1,158 14
Diluted Earnings Per Common Share before Special Items (a) $ 2.87 $ 2.53 14
Special Items Earnings Per Common Share (a) (0.13) (0.15) NM
Reported Diluted Earnings Per Common Share $ 2.74 $ 2.38 15
Cash Flows Provided by Operating Activities $ 2,170 $ 1,968 10
(a) See page 23 of our 2011 Form 10-K for further discussion of Special Items.
Contents
Dear Partners.....................................................................................1
China and A Whole Lot More .......................................................2–5
Improving US Brand Positions .................................................... 6-7
Core Strategies ...................................................................................... 8
Business Model...................................................................................... 9
Taking People With You ..................................................................... 10
ABOUT THE PAPER USED FOR THIS REPORT
The inks used in the printing of this report contain an average of 25% - 35% vegetable oils from plant
derivatives, a renewable resource. They replace petroleum based inks as an effort to also reduce
volatile organic compounds (VOCs).
The cover and first 14 pages of this report were printed using FSC-certified paper made with 50%
recycled content including 24% post-consumer waste.
www.yum.com/annualreport