Pizza Hut 2011 Annual Report Download - page 138
Download and view the complete annual report
Please find page 138 of the 2011 Pizza Hut annual report below. You can navigate through the pages in the report by either clicking on the pages listed below, or by using the keyword search tool below to find specific information within the annual report.-
 1
1 -
2
-
3
-
4
-
5
-
6
-
7
-
8
-
9
-
10
-
11
-
12
-
13
-
14
-
15
-
16
-
17
-
18
-
19
-
20
-
21
-
22
-
23
-
24
-
25
-
26
-
27
-
28
-
29
-
30
-
31
-
32
-
33
-
34
-
35
-
36
-
37
-
38
-
39
-
40
-
41
-
42
-
43
-
44
-
45
-
46
-
47
-
48
-
49
-
50
-
51
-
52
-
53
-
54
-
55
-
56
-
57
-
58
-
59
-
60
-
61
-
62
-
63
-
64
-
65
-
66
-
67
-
68
-
69
-
70
-
71
-
72
-
73
-
74
-
75
-
76
-
77
-
78
-
79
-
80
-
81
-
82
-
83
-
84
-
85
-
86
-
87
-
88
-
89
-
90
-
91
-
92
-
93
-
94
-
95
-
96
-
97
-
98
-
99
-
100
-
101
-
102
-
103
-
104
-
105
-
106
-
107
-
108
-
109
-
110
-
111
-
112
-
113
-
114
-
115
-
116
-
117
-
118
-
119
-
120
-
121
-
122
-
123
-
124
-
125
-
126
-
127
-
 128
128 -
 129
129 -
 130
130 -
 131
131 -
 132
132 -
 133
133 -
 134
134 -
 135
135 -
 136
136 -
 137
137 -
 138
138 -
 139
139 -
 140
140 -
 141
141 -
 142
142 -
 143
143 -
 144
144 -
 145
145 -
 146
146 -
 147
147 -
 148
148 -
149
-
150
-
151
-
152
-
153
-
154
-
155
-
156
-
157
-
158
-
159
-
160
-
161
-
162
-
163
-
164
-
165
-
166
-
167
-
168
-
169
-
170
-
171
-
172
-
173
-
174
-
175
-
176
-
177
-
178
-
179
-
180
-
181
-
182
-
183
-
184
-
185
-
186
-
187
-
188
-
189
-
190
-
191
-
192
-
193
-
194
-
195
-
196
-
197
-
198
-
199
-
200
-
201
-
202
-
203
-
204
-
205
-
206
-
207
-
208
-
209
-
210
-
211
-
212
 |
 |

34
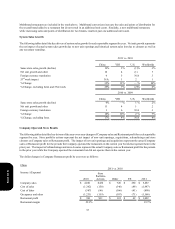
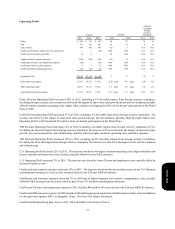
In 2011, the decrease in YRI Company sales associated with store portfolio actions was driven by refranchising, primarily Mexico,
partially offset by new unit development. Significant other factors impacting Company sales and/or Restaurant profit were
Company same-store sales growth of 3% offset by commodity inflation and higher labor costs.
In 2010, the decrease in YRI Company sales associated with store portfolio actions was driven by refranchising, primarily KFC
Taiwan, partially offset by new unit development. The increase in Restaurant profit associated with store portfolio actions was
driven by new unit development partially offset by refranchising. Another significant factor impacting Restaurant profit during
the year was labor inflation. Company same-store sales were flat for the year.
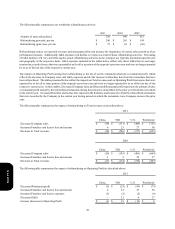
U.S.
Income / (Expense)
Company sales
Cost of sales
Cost of labor
Occupancy and other
Restaurant profit
Restaurant margin
2011 vs. 2010
2010
$ 3,355
(976)
(994)
(908)
$ 477
14.2%
Store
Portfolio
Actions
$(322)
95
101
95
$(31)
Other
$(76)
(23)
(7)
13
$(93)
FX
N/A
N/A
N/A
N/A
N/A
53rd Week
$ 43
(13)
(12)
(9)
$ 9
2011
$ 3,000
(917)
(912)
(809)
$ 362
12.1%
Income / (Expense)
Company sales
Cost of sales
Cost of labor
Occupancy and other
Restaurant profit
Restaurant margin
2010 vs. 2009
2009
$ 3,738
(1,070)
(1,121)
(1,028)
$ 519
13.9%
Store
Portfolio
Actions
$(378)
103
126
115
$(34)
Other
$(5)
(9)
1
5
$(8)
FX
N/A
N/A
N/A
N/A
N/A
2010
$ 3,355
(976)
(994)
(908)
$ 477
14.2%
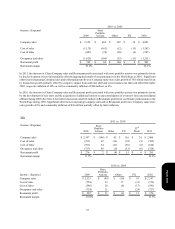
In 2011, the decrease in U.S. Company sales and Restaurant profit associated with store portfolio actions was primarily driven by
refranchising. Significant other factors impacting Company sales and/or Restaurant profit were commodity inflation of $55 million,
or 6%, Company same-store sales declines of 3%, including a negative impact from sales mix shift, and higher self-insurance
costs.
In 2010, the decrease in U.S. Company sales and Restaurant profit associated with store portfolio actions was primarily driven by
refranchising. Other significant factors impacting Restaurant profit were a negative impact from sales mix shift, partially offset
by commodity deflation of $7 million. Company same-store sales were flat for the year.
Form 10-K