Pizza Hut 2011 Annual Report Download - page 181
Download and view the complete annual report
Please find page 181 of the 2011 Pizza Hut annual report below. You can navigate through the pages in the report by either clicking on the pages listed below, or by using the keyword search tool below to find specific information within the annual report.-
 1
1 -
2
-
3
-
4
-
5
-
6
-
7
-
8
-
9
-
10
-
11
-
12
-
13
-
14
-
15
-
16
-
17
-
18
-
19
-
20
-
21
-
22
-
23
-
24
-
25
-
26
-
27
-
28
-
29
-
30
-
31
-
32
-
33
-
34
-
35
-
36
-
37
-
38
-
39
-
40
-
41
-
42
-
43
-
44
-
45
-
46
-
47
-
48
-
49
-
50
-
51
-
52
-
53
-
54
-
55
-
56
-
57
-
58
-
59
-
60
-
61
-
62
-
63
-
64
-
65
-
66
-
67
-
68
-
69
-
70
-
71
-
72
-
73
-
74
-
75
-
76
-
77
-
78
-
79
-
80
-
81
-
82
-
83
-
84
-
85
-
86
-
87
-
88
-
89
-
90
-
91
-
92
-
93
-
94
-
95
-
96
-
97
-
98
-
99
-
100
-
101
-
102
-
103
-
104
-
105
-
106
-
107
-
108
-
109
-
110
-
111
-
112
-
113
-
114
-
115
-
116
-
117
-
118
-
119
-
120
-
121
-
122
-
123
-
124
-
125
-
126
-
127
-
128
-
129
-
130
-
131
-
132
-
133
-
134
-
135
-
136
-
137
-
138
-
139
-
140
-
141
-
142
-
143
-
144
-
145
-
146
-
147
-
148
-
149
-
150
-
151
-
152
-
153
-
154
-
155
-
156
-
157
-
158
-
159
-
160
-
161
-
162
-
163
-
164
-
165
-
166
-
167
-
168
-
169
-
170
-
 171
171 -
 172
172 -
 173
173 -
 174
174 -
 175
175 -
 176
176 -
 177
177 -
 178
178 -
 179
179 -
 180
180 -
 181
181 -
 182
182 -
 183
183 -
 184
184 -
 185
185 -
 186
186 -
 187
187 -
 188
188 -
 189
189 -
 190
190 -
 191
191 -
192
-
193
-
194
-
195
-
196
-
197
-
198
-
199
-
200
-
201
-
202
-
203
-
204
-
205
-
206
-
207
-
208
-
209
-
210
-
211
-
212
 |
 |

77
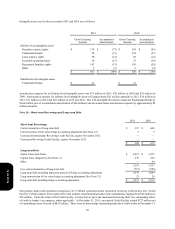
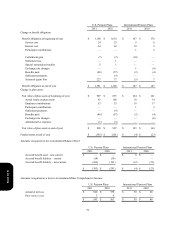
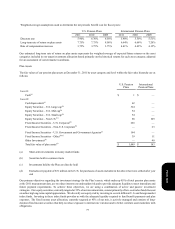
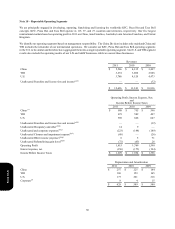
Weighted-average assumptions used to determine the net periodic benefit cost for fiscal years:
Discount rate
Long-term rate of return on plan assets
Rate of compensation increase
U.S. Pension Plans
2011
5.90%
7.75%
3.75%
2010
6.30%
7.75%
3.75%
2009
6.50%
8.00%
3.75%
International Pension Plans
2011
5.40%
6.64%
4.41%
2010
5.50%
6.66%
4.42%
2009
5.51%
7.20%
4.12%
Our estimated long-term rate of return on plan assets represents the weighted-average of expected future returns on the asset
categories included in our target investment allocation based primarily on the historical returns for each asset category, adjusted
for an assessment of current market conditions.
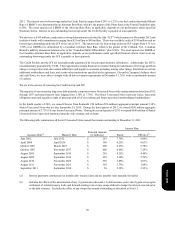
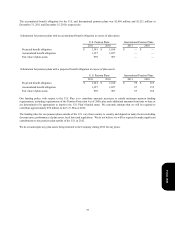
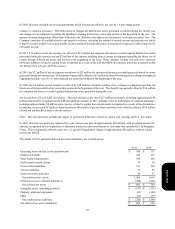
Plan Assets
The fair values of our pension plan assets at December 31, 2011 by asset category and level within the fair value hierarchy are as
follows:
Level 1:
Cash(a)
Level 2:
Cash Equivalents(a)
Equity Securities – U.S. Large cap(b)
Equity Securities – U.S. Mid cap(b)
Equity Securities – U.S. Small cap(b)
Equity Securities – Non-U.S.(b)
Fixed Income Securities – U.S. Corporate(b)
Fixed Income Securities – Non-U.S. Corporate(b)
Fixed Income Securities – U.S. Government and Government Agencies(c)
Fixed Income Securities – Other(b)(c)
Other Investments(b)
Total fair value of plan assets(d)
U.S. Pension
Plans
$ 1
62
324
54
54
88
263
—
164
39
—
$ 1,049
International
Pension Plans
$ —
—
—
—
—
109
—
23
—
11
40
$ 183
(a) Short-term investments in money market funds
(b) Securities held in common trusts
(c) Investments held by the Plan are directly held
(d) Excludes net payable of $51 million in the U.S. for purchases of assets included in the above that were settled after year
end
Our primary objectives regarding the investment strategy for the Plan’s assets, which make up 85% of total pension plan assets
at the 2011 measurement date, are to reduce interest rate and market risk and to provide adequate liquidity to meet immediate and
future payment requirements. To achieve these objectives, we are using a combination of active and passive investment
strategies. Our equity securities, currently targeted at 55% of our investment mix, consist primarily of low-cost index funds focused
on achieving long-term capital appreciation. We diversify our equity risk by investing in several different U.S. and foreign market
index funds. Investing in these index funds provides us with the adequate liquidity required to fund benefit payments and plan
expenses. The fixed income asset allocation, currently targeted at 45% of our mix, is actively managed and consists of long-
duration fixed income securities that help to reduce exposure to interest rate variation and to better correlate asset maturities with
obligations.
Form 10-K