Pizza Hut 2011 Annual Report Download - page 55
Download and view the complete annual report
Please find page 55 of the 2011 Pizza Hut annual report below. You can navigate through the pages in the report by either clicking on the pages listed below, or by using the keyword search tool below to find specific information within the annual report.-
 1
1 -
2
-
3
-
4
-
5
-
6
-
7
-
8
-
9
-
10
-
11
-
12
-
13
-
14
-
15
-
16
-
17
-
18
-
19
-
20
-
21
-
22
-
23
-
24
-
25
-
26
-
27
-
28
-
29
-
30
-
31
-
32
-
33
-
34
-
35
-
36
-
37
-
38
-
39
-
40
-
41
-
42
-
43
-
44
-
 45
45 -
 46
46 -
 47
47 -
 48
48 -
 49
49 -
 50
50 -
 51
51 -
 52
52 -
 53
53 -
 54
54 -
 55
55 -
 56
56 -
 57
57 -
 58
58 -
 59
59 -
 60
60 -
 61
61 -
 62
62 -
 63
63 -
 64
64 -
 65
65 -
66
-
67
-
68
-
69
-
70
-
71
-
72
-
73
-
74
-
75
-
76
-
77
-
78
-
79
-
80
-
81
-
82
-
83
-
84
-
85
-
86
-
87
-
88
-
89
-
90
-
91
-
92
-
93
-
94
-
95
-
96
-
97
-
98
-
99
-
100
-
101
-
102
-
103
-
104
-
105
-
106
-
107
-
108
-
109
-
110
-
111
-
112
-
113
-
114
-
115
-
116
-
117
-
118
-
119
-
120
-
121
-
122
-
123
-
124
-
125
-
126
-
127
-
128
-
129
-
130
-
131
-
132
-
133
-
134
-
135
-
136
-
137
-
138
-
139
-
140
-
141
-
142
-
143
-
144
-
145
-
146
-
147
-
148
-
149
-
150
-
151
-
152
-
153
-
154
-
155
-
156
-
157
-
158
-
159
-
160
-
161
-
162
-
163
-
164
-
165
-
166
-
167
-
168
-
169
-
170
-
171
-
172
-
173
-
174
-
175
-
176
-
177
-
178
-
179
-
180
-
181
-
182
-
183
-
184
-
185
-
186
-
187
-
188
-
189
-
190
-
191
-
192
-
193
-
194
-
195
-
196
-
197
-
198
-
199
-
200
-
201
-
202
-
203
-
204
-
205
-
206
-
207
-
208
-
209
-
210
-
211
-
212
 |
 |
8MAR201212334344
16MAR201218542623
28MAR201223362614
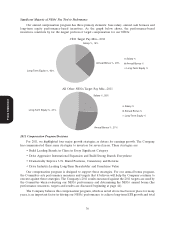
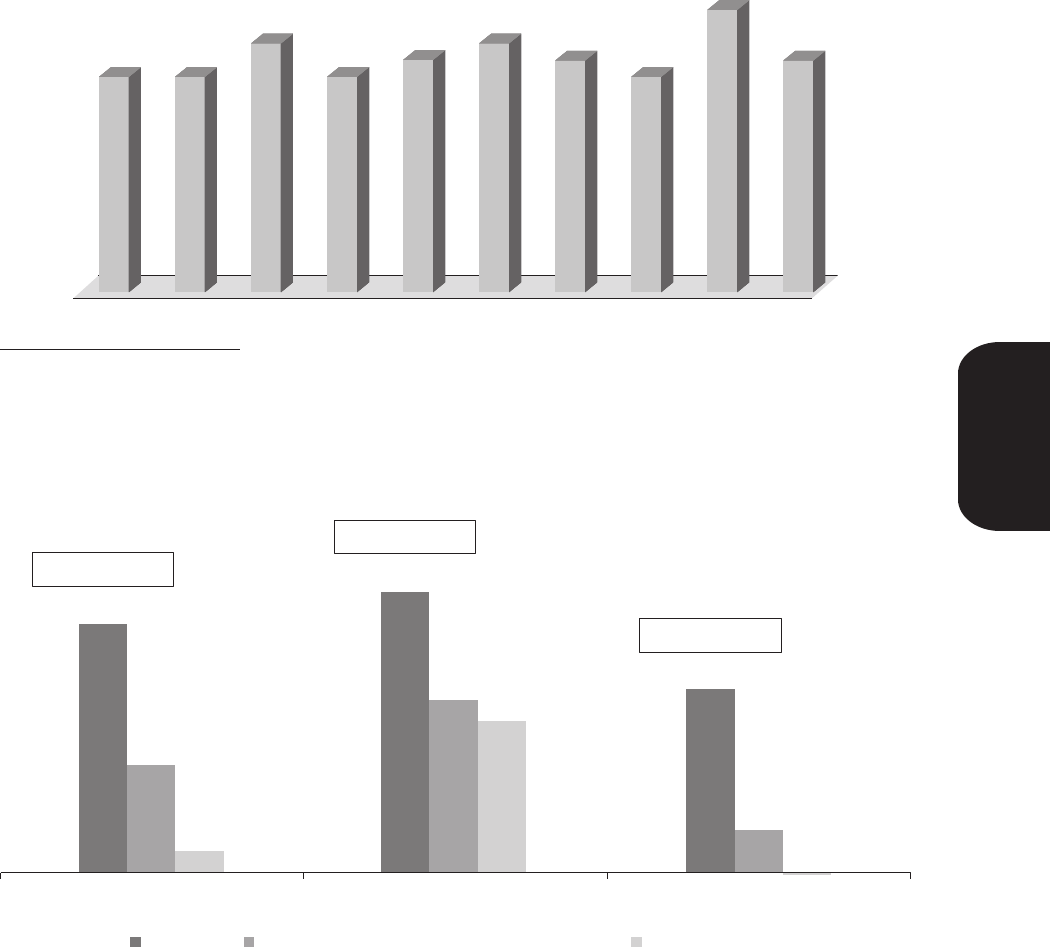
shareholder return (‘‘TSR’’). The success of our strategy is evidenced by our one, three and five-year
results for TSR as compared to our compensation peer group (made up of the retail, hospitality and
nondurable consumer products companies described at page 43) and our consistent year-over-year EPS
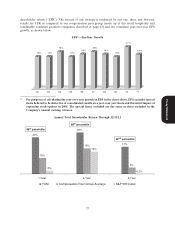
growth, as shown below:
EPS*—Ten-Year Growth
´02 ´03 ´04 ´05 ´06 ´07 ´08 ´09 ´10 ´11
13% 13%
15%
13%
14%
15%
14%
13%
17%
14%
* For purposes of calculating the year-over-year growth in EPS in the chart above, EPS excludes special
items believed to be distortive of consolidated results on a year-over-year basis and the initial impact of
expensing stock options in 2005. The special items excluded are the same as those excluded in the
Company’s annual earning releases.
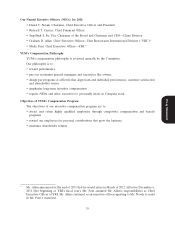
Annual Total Shareholder Return Through 12/31/11
Proxy Statement
23%
26%
16% 17%
4%
2%
10%
14%
-0.2%
1-Year 3-Year 5-Year
YUM Compensation Peer Group Average S&P 500 Index
86th percentile
86th percentile
92nd percentile
37