Pizza Hut 2011 Annual Report Download - page 185
Download and view the complete annual report
Please find page 185 of the 2011 Pizza Hut annual report below. You can navigate through the pages in the report by either clicking on the pages listed below, or by using the keyword search tool below to find specific information within the annual report.-
 1
1 -
2
-
3
-
4
-
5
-
6
-
7
-
8
-
9
-
10
-
11
-
12
-
13
-
14
-
15
-
16
-
17
-
18
-
19
-
20
-
21
-
22
-
23
-
24
-
25
-
26
-
27
-
28
-
29
-
30
-
31
-
32
-
33
-
34
-
35
-
36
-
37
-
38
-
39
-
40
-
41
-
42
-
43
-
44
-
45
-
46
-
47
-
48
-
49
-
50
-
51
-
52
-
53
-
54
-
55
-
56
-
57
-
58
-
59
-
60
-
61
-
62
-
63
-
64
-
65
-
66
-
67
-
68
-
69
-
70
-
71
-
72
-
73
-
74
-
75
-
76
-
77
-
78
-
79
-
80
-
81
-
82
-
83
-
84
-
85
-
86
-
87
-
88
-
89
-
90
-
91
-
92
-
93
-
94
-
95
-
96
-
97
-
98
-
99
-
100
-
101
-
102
-
103
-
104
-
105
-
106
-
107
-
108
-
109
-
110
-
111
-
112
-
113
-
114
-
115
-
116
-
117
-
118
-
119
-
120
-
121
-
122
-
123
-
124
-
125
-
126
-
127
-
128
-
129
-
130
-
131
-
132
-
133
-
134
-
135
-
136
-
137
-
138
-
139
-
140
-
141
-
142
-
143
-
144
-
145
-
146
-
147
-
148
-
149
-
150
-
151
-
152
-
153
-
154
-
155
-
156
-
157
-
158
-
159
-
160
-
161
-
162
-
163
-
164
-
165
-
166
-
167
-
168
-
169
-
170
-
171
-
172
-
173
-
174
-
 175
175 -
 176
176 -
 177
177 -
 178
178 -
 179
179 -
 180
180 -
 181
181 -
 182
182 -
 183
183 -
 184
184 -
 185
185 -
 186
186 -
 187
187 -
 188
188 -
 189
189 -
 190
190 -
 191
191 -
 192
192 -
 193
193 -
 194
194 -
 195
195 -
196
-
197
-
198
-
199
-
200
-
201
-
202
-
203
-
204
-
205
-
206
-
207
-
208
-
209
-
210
-
211
-
212
 |
 |

81
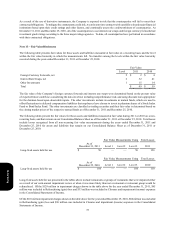
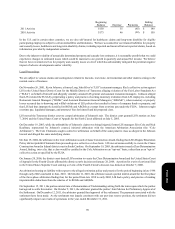
Impact on Net Income
The components of share-based compensation expense and the related income tax benefits are shown in the following table:
Options and SARs
Restricted Stock Units
Performance Share Units
Total Share-based Compensation Expense
Deferred Tax Benefit recognized
EID compensation expense not share-based
2011
$ 49
5
5
$ 59
$ 18
$ 2
2010
$ 40
5
2
$ 47
$ 13
$ 4
2009
$ 48
7
1
$ 56
$ 17
$ 4
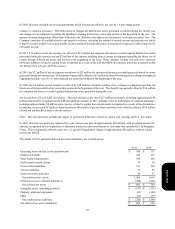
Cash received from stock option exercises for 2011, 2010 and 2009, was $59 million, $102 million and $113 million,
respectively. Tax benefits realized on our tax returns from tax deductions associated with stock options and SARs exercised for
2011, 2010 and 2009 totaled $72 million, $82 million and $68 million, respectively.
Note 16 – Shareholders’ Equity
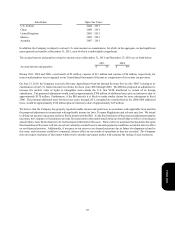
Under the authority of our Board of Directors, we repurchased shares of our Common Stock during 2011 and 2010. All amounts
exclude applicable transaction fees. There were no shares of our Common Stock repurchased during 2009.
Authorization Date
November 2011
January 2011
March 2010
September 2009
Total
Shares Repurchased
(thousands)
2011
—
10,864
3,441
—
14,305 (a)
2010
—
—
2,161
7,598
9,759 (a)
2009
—
—
—
—
—
Dollar Value of Shares
Repurchased
2011
$ —
562
171
—
$ 733 (a)
2010
$ —
—
107
283
$ 390 (a)
2009
$ —
—
—
—
$ —
(a) 2011 amount excludes and 2010 amount includes the effect of $19 million in share repurchases (0.4 million shares)
with trade dates prior to the 2010 fiscal year end but cash settlement dates subsequent to the 2010 fiscal year.
As of December 31, 2011, we have $188 million available for future repurchases under our January 2011 share repurchase
authorization. Additionally, on November 18, 2011, our Board of Directors authorized share repurchases through May 2013 of
up to $750 million (excluding applicable transaction fees) of our outstanding Common Stock. No shares have been repurchased
under the November 2011 authorization as of December 31, 2011.
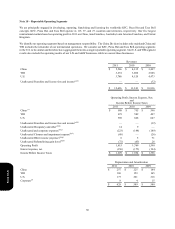
Accumulated Other Comprehensive Income (Loss) – Comprehensive income is Net Income plus certain other items that are
recorded directly to Shareholders’ Equity. The following table gives further detail regarding the composition of accumulated other
comprehensive loss at December 31, 2011 and December 25, 2010. Refer to Note 14 for additional information about our pension
and post-retirement plan accounting and Note 12 for additional information about our derivative instruments.
Foreign currency translation adjustment
Pension and post-retirement losses, net of tax
Net unrealized losses on derivative instruments, net of tax
Total accumulated other comprehensive loss
2011
$ 140
(375)
(12)
$(247)
2010
$ 55
(269)
(13)
$(227)
Form 10-K