Pizza Hut 2011 Annual Report Download - page 190
Download and view the complete annual report
Please find page 190 of the 2011 Pizza Hut annual report below. You can navigate through the pages in the report by either clicking on the pages listed below, or by using the keyword search tool below to find specific information within the annual report.-
 1
1 -
2
-
3
-
4
-
5
-
6
-
7
-
8
-
9
-
10
-
11
-
12
-
13
-
14
-
15
-
16
-
17
-
18
-
19
-
20
-
21
-
22
-
23
-
24
-
25
-
26
-
27
-
28
-
29
-
30
-
31
-
32
-
33
-
34
-
35
-
36
-
37
-
38
-
39
-
40
-
41
-
42
-
43
-
44
-
45
-
46
-
47
-
48
-
49
-
50
-
51
-
52
-
53
-
54
-
55
-
56
-
57
-
58
-
59
-
60
-
61
-
62
-
63
-
64
-
65
-
66
-
67
-
68
-
69
-
70
-
71
-
72
-
73
-
74
-
75
-
76
-
77
-
78
-
79
-
80
-
81
-
82
-
83
-
84
-
85
-
86
-
87
-
88
-
89
-
90
-
91
-
92
-
93
-
94
-
95
-
96
-
97
-
98
-
99
-
100
-
101
-
102
-
103
-
104
-
105
-
106
-
107
-
108
-
109
-
110
-
111
-
112
-
113
-
114
-
115
-
116
-
117
-
118
-
119
-
120
-
121
-
122
-
123
-
124
-
125
-
126
-
127
-
128
-
129
-
130
-
131
-
132
-
133
-
134
-
135
-
136
-
137
-
138
-
139
-
140
-
141
-
142
-
143
-
144
-
145
-
146
-
147
-
148
-
149
-
150
-
151
-
152
-
153
-
154
-
155
-
156
-
157
-
158
-
159
-
160
-
161
-
162
-
163
-
164
-
165
-
166
-
167
-
168
-
169
-
170
-
171
-
172
-
173
-
174
-
175
-
176
-
177
-
178
-
179
-
 180
180 -
 181
181 -
 182
182 -
 183
183 -
 184
184 -
 185
185 -
 186
186 -
 187
187 -
 188
188 -
 189
189 -
 190
190 -
 191
191 -
 192
192 -
 193
193 -
 194
194 -
 195
195 -
 196
196 -
 197
197 -
 198
198 -
 199
199 -
 200
200 -
201
-
202
-
203
-
204
-
205
-
206
-
207
-
208
-
209
-
210
-
211
-
212
 |
 |

86
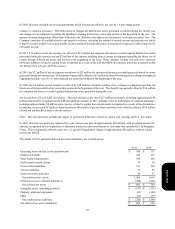
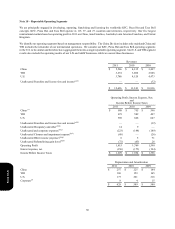
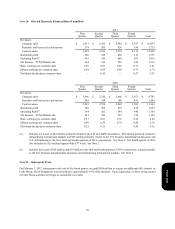
Note 18 – Reportable Operating Segments
We are principally engaged in developing, operating, franchising and licensing the worldwide KFC, Pizza Hut and Taco Bell
concepts. KFC, Pizza Hut and Taco Bell operate in 115, 97, and 27 countries and territories, respectively. Our five largest
international markets based on operating profit in 2011 are China, Asia Franchise, Australia, Latin America Franchise, and United
Kingdom.
We identify our operating segments based on management responsibility. The China Division includes only mainland China and
YRI includes the remainder of our international operations. We consider our KFC, Pizza Hut and Taco Bell operating segments
in the U.S. to be similar and therefore have aggregated them into a single reportable operating segment. Our U.S. and YRI segment
results also include the operating results of our LJS and A&W businesses while we owned those businesses.
China
YRI
U.S.
Unallocated Franchise and license fees and income(a)(b)
Revenues
2011
$ 5,566
3,274
3,786
—
$ 12,626
2010
$ 4,135
3,088
4,120
—
$ 11,343
2009
$ 3,407
2,988
4,473
(32)
$ 10,836
China (c)
YRI
U.S.
Unallocated Franchise and license fees and income(a)(b)
Unallocated Occupancy and other(b)(d)
Unallocated and corporate expenses(b)(e)
Unallocated Closures and impairment expense(b)(f)
Unallocated Other income (expense)(b)(g)
Unallocated Refranchising gain (loss)(b)(h)
Operating Profit
Interest expense, net
Income Before Income Taxes
Operating Profit; Interest Expense, Net;
and
Income Before Income Taxes
2011
$ 908
673
589
—
14
(223)
(80)
6
(72)
1,815
(156)
$ 1,659
2010
$ 755
589
668
—
9
(194)
—
5
(63)
1,769
(175)
$ 1,594
2009
$ 596
497
647
(32)
—
(189)
(26)
71
26
1,590
(194)
$ 1,396
China
YRI
U.S.
Corporate(d)
Depreciation and Amortization
2011
$ 257
186
177
8
$ 628
2010
$ 225
159
201
4
$ 589
2009
$ 184
165
216
15
$ 580
Form 10-K