Pizza Hut 2011 Annual Report Download - page 87
Download and view the complete annual report
Please find page 87 of the 2011 Pizza Hut annual report below. You can navigate through the pages in the report by either clicking on the pages listed below, or by using the keyword search tool below to find specific information within the annual report.-
 1
1 -
2
-
3
-
4
-
5
-
6
-
7
-
8
-
9
-
10
-
11
-
12
-
13
-
14
-
15
-
16
-
17
-
18
-
19
-
20
-
21
-
22
-
23
-
24
-
25
-
26
-
27
-
28
-
29
-
30
-
31
-
32
-
33
-
34
-
35
-
36
-
37
-
38
-
39
-
40
-
41
-
42
-
43
-
44
-
45
-
46
-
47
-
48
-
49
-
50
-
51
-
52
-
53
-
54
-
55
-
56
-
57
-
58
-
59
-
60
-
61
-
62
-
63
-
64
-
65
-
66
-
67
-
68
-
69
-
70
-
71
-
72
-
73
-
74
-
75
-
76
-
 77
77 -
 78
78 -
 79
79 -
 80
80 -
 81
81 -
 82
82 -
 83
83 -
 84
84 -
 85
85 -
 86
86 -
 87
87 -
 88
88 -
 89
89 -
 90
90 -
 91
91 -
 92
92 -
 93
93 -
 94
94 -
 95
95 -
 96
96 -
 97
97 -
98
-
99
-
100
-
101
-
102
-
103
-
104
-
105
-
106
-
107
-
108
-
109
-
110
-
111
-
112
-
113
-
114
-
115
-
116
-
117
-
118
-
119
-
120
-
121
-
122
-
123
-
124
-
125
-
126
-
127
-
128
-
129
-
130
-
131
-
132
-
133
-
134
-
135
-
136
-
137
-
138
-
139
-
140
-
141
-
142
-
143
-
144
-
145
-
146
-
147
-
148
-
149
-
150
-
151
-
152
-
153
-
154
-
155
-
156
-
157
-
158
-
159
-
160
-
161
-
162
-
163
-
164
-
165
-
166
-
167
-
168
-
169
-
170
-
171
-
172
-
173
-
174
-
175
-
176
-
177
-
178
-
179
-
180
-
181
-
182
-
183
-
184
-
185
-
186
-
187
-
188
-
189
-
190
-
191
-
192
-
193
-
194
-
195
-
196
-
197
-
198
-
199
-
200
-
201
-
202
-
203
-
204
-
205
-
206
-
207
-
208
-
209
-
210
-
211
-
212
 |
 |

16MAR201218542623
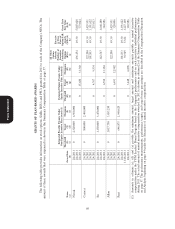
Investments in the YUM! Stock Fund are only distributed in shares of Company stock.
Under the LRP, participants receive a distribution of their vested account balance following the later
to occur of their attainment of age 55 or retirement from the Company.
Executive Registrant Aggregate Aggregate Aggregate
Contributions Contributions Earnings Withdrawals/ Balance
in Last FY in Last FY in Last FY Distributions at Last FYE
Name ($)(1) ($) ($)(2) ($)(3) ($)(4)
(a) (b) (c) (d) (e) (f)
Novak 5,066,880 — 23,636,197 130,624 143,102,624
Carucci 1,589,445 — 1,398,075 518,940 11,605,416
Su 2,628,986 — 595,205 3,891,518 4,831,328
Allan — — 2,681,854 102,507 15,368,286
Pant — 300,000 1,028,853 162,288 6,757,042
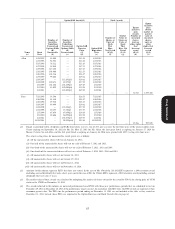
(1) Amounts in this column reflect amounts that were also reported as compensation in our Summary
Compensation Table filed last year or would have been reported as compensation in our Summary
Compensation Table last year if the executive were a NEO.
(2) Amounts in this column reflect earnings during the last fiscal year on deferred amounts. All earnings
are based on the investment alternatives offered under the EID Program described in the narrative
above this table. Since these earnings are market based returns, they are not reported in the Summary
Compensation Table.
(3) All amounts shown were distributed in accordance with the executive’s deferral election, except in the
case of the following amount distributed to pay payroll taxes due upon vesting of RSUs under the EID
Program during the year:
Carucci .................. 38,380.34
Allan .................... 102,506.81
Pant..................... 47,476.12
Proxy Statement
(4) Amounts reflected in this column are the year-end balances for each executive under the EID
Program. As required under SEC rules, below is the portion of the year-end balance for each
executive which has previously been reported as compensation to the executive in the Company’s
Summary Compensation Table for 2011 and prior years or would have been reported as compensation
if the executive had been a NEO in those previous years.
Novak ................... 43,859,487
Carucci .................. 6,699,203
Su...................... 4,347,903
Allan .................... 5,024,820
Pant..................... 2,880,085
The difference between these amounts and the amount of the year-end balance for each executive
represents the total aggregate earnings accumulated under the program with respect to that compensation.
69