Pizza Hut 2011 Annual Report Download - page 65
Download and view the complete annual report
Please find page 65 of the 2011 Pizza Hut annual report below. You can navigate through the pages in the report by either clicking on the pages listed below, or by using the keyword search tool below to find specific information within the annual report.-
 1
1 -
2
-
3
-
4
-
5
-
6
-
7
-
8
-
9
-
10
-
11
-
12
-
13
-
14
-
15
-
16
-
17
-
18
-
19
-
20
-
21
-
22
-
23
-
24
-
25
-
26
-
27
-
28
-
29
-
30
-
31
-
32
-
33
-
34
-
35
-
36
-
37
-
38
-
39
-
40
-
41
-
42
-
43
-
44
-
45
-
46
-
47
-
48
-
49
-
50
-
51
-
52
-
53
-
54
-
 55
55 -
 56
56 -
 57
57 -
 58
58 -
 59
59 -
 60
60 -
 61
61 -
 62
62 -
 63
63 -
 64
64 -
 65
65 -
 66
66 -
 67
67 -
 68
68 -
 69
69 -
 70
70 -
 71
71 -
 72
72 -
 73
73 -
 74
74 -
 75
75 -
76
-
77
-
78
-
79
-
80
-
81
-
82
-
83
-
84
-
85
-
86
-
87
-
88
-
89
-
90
-
91
-
92
-
93
-
94
-
95
-
96
-
97
-
98
-
99
-
100
-
101
-
102
-
103
-
104
-
105
-
106
-
107
-
108
-
109
-
110
-
111
-
112
-
113
-
114
-
115
-
116
-
117
-
118
-
119
-
120
-
121
-
122
-
123
-
124
-
125
-
126
-
127
-
128
-
129
-
130
-
131
-
132
-
133
-
134
-
135
-
136
-
137
-
138
-
139
-
140
-
141
-
142
-
143
-
144
-
145
-
146
-
147
-
148
-
149
-
150
-
151
-
152
-
153
-
154
-
155
-
156
-
157
-
158
-
159
-
160
-
161
-
162
-
163
-
164
-
165
-
166
-
167
-
168
-
169
-
170
-
171
-
172
-
173
-
174
-
175
-
176
-
177
-
178
-
179
-
180
-
181
-
182
-
183
-
184
-
185
-
186
-
187
-
188
-
189
-
190
-
191
-
192
-
193
-
194
-
195
-
196
-
197
-
198
-
199
-
200
-
201
-
202
-
203
-
204
-
205
-
206
-
207
-
208
-
209
-
210
-
211
-
212
 |
 |

16MAR201218542623
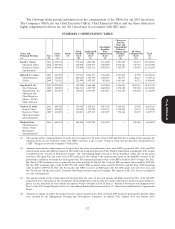
Application of YUM Leaders’ Bonus Program Formula to NEOs
Based on the Committee’s determinations as described above, the following table sets forth the
formula and the calculation of annual bonus for each NEO.
Team Individual
Annual Bonus Performance Performance
Formula: Base Salary ⍥Target % ⍥Factor ⍥Factor = Bonus Award
Novak $1,450,000 ǂ160% ǂ145% ǂ135% = $4,541,400
Carucci $800,000 ǂ100% ǂ145% ǂ135% = $1,566,000
Su $1,000,000 ǂ115% ǂ180% ǂ150% = $3,105,000
Allan $885,000 ǂ115% ǂ132% ǂ150% = $2,015,145
Pant $750,000 ǂ86.25% ǂ132% ǂ130% = $1,110,038
Note: Messrs. Su’s, Allan’s, and Pant’s team performance factor is based on 75% of their Division team
performance factor and 25% of the consolidated Yum team performance factor. Mr. Novak’s
performance is discussed beginning on page 48.
Long-term Incentive Compensation
The principal purpose of our long-term incentive compensation program (‘‘LTI Plan’’) is to motivate
our NEOs and other executives to help us achieve our long-range performance goals that will enhance our
value and, as a result, enhance our shareholders’ returns on their investments.
Under our LTI Plan, our NEOs are awarded long-term incentives primarily in the form of
non-qualified stock options or stock-settled stock appreciation rights (‘‘SARs’’). The type of award granted
is based upon the NEO’s local tax jurisdiction. Long-term incentive award ranges are established based
upon the peer group data. In general, our stock options and SARs have ten-year terms and vest 25% per
year over four years.
Each year the Committee reviews the mix of long-term incentives to determine if it is appropriate to
Proxy Statement
continue predominantly using stock options and SARs as the long-term incentive vehicle. The Committee
continues to choose stock options and SARs because they emphasize YUM’s focus on long-term growth,
they reward employees only if the stock price goes up and they align Restaurant General Managers and
senior management on the same equity incentive program. The Company believes that this compensation
program design combined with the Company’s strong stock ownership guidelines (discussed at page 52)
and an annual bonus program which reaffirms key Division metrics (such as profit growth, store unit
growth, margin improvement and customer satisfaction metrics) creates an overall incentive program that
maximizes performance and alignment with shareholders (and, as discussed at page 9, does so without
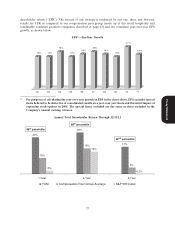
creating excessive risk). The Company’s long-term results discussed above suggest that shareholders have
been well served with this design.
Consistent with prior years for each NEO other than Mr. Novak (who is discussed below), the 2011
Stock Option/SARs grant was awarded based on the Committee’s subjective assessment of each NEO’s
prior year individual and team performance, expected contribution in future years and consideration of the
peer group data, subject to the individual’s achievement of his stock ownership guidelines. The Committee
did not assign a weight to any particular item.
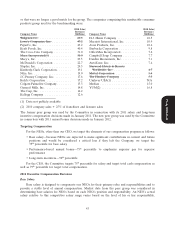
Based on this assessment, Messrs. Su and Pant received grants above the 50th percentile. Messrs. Allan
and Carucci received stock appreciation rights grants at the 50th percentile. Each SAR and stock option
was granted with an exercise price based on the closing market price of the underlying YUM common
stock on the date of grant. The Committee does not measure or review the actual percentile above or
below the 50th percentile when making its final LTI award decision. In addition, the Committee does not
47