Pizza Hut 2011 Annual Report Download - page 165
Download and view the complete annual report
Please find page 165 of the 2011 Pizza Hut annual report below. You can navigate through the pages in the report by either clicking on the pages listed below, or by using the keyword search tool below to find specific information within the annual report.-
 1
1 -
2
-
3
-
4
-
5
-
6
-
7
-
8
-
9
-
10
-
11
-
12
-
13
-
14
-
15
-
16
-
17
-
18
-
19
-
20
-
21
-
22
-
23
-
24
-
25
-
26
-
27
-
28
-
29
-
30
-
31
-
32
-
33
-
34
-
35
-
36
-
37
-
38
-
39
-
40
-
41
-
42
-
43
-
44
-
45
-
46
-
47
-
48
-
49
-
50
-
51
-
52
-
53
-
54
-
55
-
56
-
57
-
58
-
59
-
60
-
61
-
62
-
63
-
64
-
65
-
66
-
67
-
68
-
69
-
70
-
71
-
72
-
73
-
74
-
75
-
76
-
77
-
78
-
79
-
80
-
81
-
82
-
83
-
84
-
85
-
86
-
87
-
88
-
89
-
90
-
91
-
92
-
93
-
94
-
95
-
96
-
97
-
98
-
99
-
100
-
101
-
102
-
103
-
104
-
105
-
106
-
107
-
108
-
109
-
110
-
111
-
112
-
113
-
114
-
115
-
116
-
117
-
118
-
119
-
120
-
121
-
122
-
123
-
124
-
125
-
126
-
127
-
128
-
129
-
130
-
131
-
132
-
133
-
134
-
135
-
136
-
137
-
138
-
139
-
140
-
141
-
142
-
143
-
144
-
145
-
146
-
147
-
148
-
149
-
150
-
151
-
152
-
153
-
154
-
 155
155 -
 156
156 -
 157
157 -
 158
158 -
 159
159 -
 160
160 -
 161
161 -
 162
162 -
 163
163 -
 164
164 -
 165
165 -
 166
166 -
 167
167 -
 168
168 -
 169
169 -
 170
170 -
 171
171 -
 172
172 -
 173
173 -
 174
174 -
 175
175 -
176
-
177
-
178
-
179
-
180
-
181
-
182
-
183
-
184
-
185
-
186
-
187
-
188
-
189
-
190
-
191
-
192
-
193
-
194
-
195
-
196
-
197
-
198
-
199
-
200
-
201
-
202
-
203
-
204
-
205
-
206
-
207
-
208
-
209
-
210
-
211
-
212
 |
 |

61
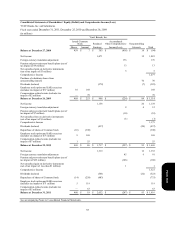
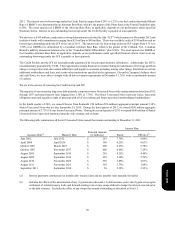
record the full value of share repurchases, upon the trade date, against Common Stock on our Consolidated Balance Sheet except
when to do so would result in a negative balance in such Common Stock account. In such instances, on a period basis, we record
the cost of any further share repurchases as a reduction in retained earnings. Due to the large number of share repurchases and
the increase in the market value of our stock over the past several years, our Common Stock balance is frequently zero at the end
of any period. Accordingly, $483 million in share repurchases were recorded as a reduction in Retained Earnings in 2011. Our
Common Stock balance was such that no share repurchases impacted Retained Earnings in 2010. There were no shares of our
Common Stock repurchased during 2009. See Note 16 for additional information.
Pension and Post-retirement Medical Benefits. We measure and recognize the overfunded or underfunded status of our pension
and post-retirement plans as an asset or liability in our Consolidated Balance Sheet as of our fiscal year end. The funded status
represents the difference between the projected benefit obligations and the fair value of plan assets. The projected benefit obligation
is the present value of benefits earned to date by plan participants, including the effect of future salary increases, as applicable. The
difference between the projected benefit obligations and the fair value of plan assets that has not previously been recognized in
our Consolidated Statement of Income is recorded as a component of Accumulated other comprehensive income (loss).
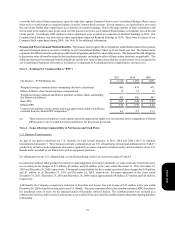
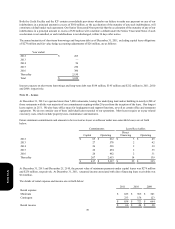
Note 3 – Earnings Per Common Share (“EPS”)
Net Income – YUM! Brands, Inc.
Weighted-average common shares outstanding (for basic calculation)
Effect of dilutive share-based employee compensation
Weighted-average common and dilutive potential common shares outstanding
(for diluted calculation)
Basic EPS
Diluted EPS
Unexercised employee stock options and stock appreciation rights (in millions)
excluded from the diluted EPS computation(a)
2011
$ 1,319
469
12
481
$ 2.81
$ 2.74
4.2
2010
$ 1,158
474
12
486
$ 2.44
$ 2.38
2.2
2009
$ 1,071
471
12
483
$ 2.28
$ 2.22
13.3
(a) These unexercised employee stock options and stock appreciation rights were not included in the computation of diluted
EPS because to do so would have been antidilutive for the periods presented.
Note 4 – Items Affecting Comparability of Net Income and Cash Flows
U.S. Business Transformation
As part of our plan to transform our U.S. business we took several measures in 2011, 2010 and 2009 ("the U.S. business
transformation measures"). These measures include: continuation of our U.S. refranchising; General and Administrative ("G&A")
productivity initiatives and realignment of resources (primarily severance and early retirement costs); and investments in our U.S.
Brands made on behalf of our franchisees such as equipment purchases.
For information on our U.S. refranchising, see the Refranchising (Gain) Loss section on pages 63 and 64.
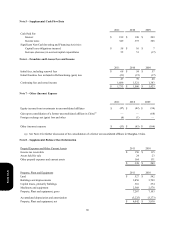
In connection with our G&A productivity initiatives and realignment of resources (primarily severance and early retirement costs),
we recorded pre-tax charges of $21 million, $9 million and $16 million in the years ended December 31, 2011, December 25,
2010 and December 26, 2009, respectively. The unpaid current liability for the severance portion of these charges was $18 million
and $1 million as of December 31, 2011 and December 25, 2010, respectively. Severance payments in the years ended
December 31, 2011, December 25, 2010 and December 26, 2009 totaled approximately $4 million, $7 million and $26 million,
respectively.
Additionally, the Company recognized a reduction to Franchise and license fees and income of $32 million in the year ended
December 26, 2009 related to investments in our U.S. Brands. These investments reflected our reimbursements to KFC franchisees
for installation costs of ovens for the national launch of Kentucky Grilled Chicken. The reimbursements were recorded as a
reduction to Franchise and license fees and income as we would not have provided the reimbursements absent the ongoing franchise
relationship.
Form 10-K