Pizza Hut 2011 Annual Report Download - page 75
Download and view the complete annual report
Please find page 75 of the 2011 Pizza Hut annual report below. You can navigate through the pages in the report by either clicking on the pages listed below, or by using the keyword search tool below to find specific information within the annual report.-
 1
1 -
2
-
3
-
4
-
5
-
6
-
7
-
8
-
9
-
10
-
11
-
12
-
13
-
14
-
15
-
16
-
17
-
18
-
19
-
20
-
21
-
22
-
23
-
24
-
25
-
26
-
27
-
28
-
29
-
30
-
31
-
32
-
33
-
34
-
35
-
36
-
37
-
38
-
39
-
40
-
41
-
42
-
43
-
44
-
45
-
46
-
47
-
48
-
49
-
50
-
51
-
52
-
53
-
54
-
55
-
56
-
57
-
58
-
59
-
60
-
61
-
62
-
63
-
64
-
 65
65 -
 66
66 -
 67
67 -
 68
68 -
 69
69 -
 70
70 -
 71
71 -
 72
72 -
 73
73 -
 74
74 -
 75
75 -
 76
76 -
 77
77 -
 78
78 -
 79
79 -
 80
80 -
 81
81 -
 82
82 -
 83
83 -
 84
84 -
 85
85 -
86
-
87
-
88
-
89
-
90
-
91
-
92
-
93
-
94
-
95
-
96
-
97
-
98
-
99
-
100
-
101
-
102
-
103
-
104
-
105
-
106
-
107
-
108
-
109
-
110
-
111
-
112
-
113
-
114
-
115
-
116
-
117
-
118
-
119
-
120
-
121
-
122
-
123
-
124
-
125
-
126
-
127
-
128
-
129
-
130
-
131
-
132
-
133
-
134
-
135
-
136
-
137
-
138
-
139
-
140
-
141
-
142
-
143
-
144
-
145
-
146
-
147
-
148
-
149
-
150
-
151
-
152
-
153
-
154
-
155
-
156
-
157
-
158
-
159
-
160
-
161
-
162
-
163
-
164
-
165
-
166
-
167
-
168
-
169
-
170
-
171
-
172
-
173
-
174
-
175
-
176
-
177
-
178
-
179
-
180
-
181
-
182
-
183
-
184
-
185
-
186
-
187
-
188
-
189
-
190
-
191
-
192
-
193
-
194
-
195
-
196
-
197
-
198
-
199
-
200
-
201
-
202
-
203
-
204
-
205
-
206
-
207
-
208
-
209
-
210
-
211
-
212
 |
 |

16MAR201218542623
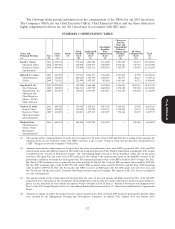
The following tables provide information on the compensation of the NEOs for our 2011 fiscal year.
The Company’s NEOs are our Chief Executive Officer, Chief Financial Officer and our three other most
highly compensated officers for our 2011 fiscal year in accordance with SEC rules.
SUMMARY COMPENSATION TABLE
Change in
Pension
Value and
Non-Equity Nonqualified
Incentive Deferred
Stock Option/SAR Plan Compensation All Other
Name and Salary Bonus Awards Awards Compensation Earnings Compensation Total
Principal Position Year ($)(1) ($) ($)(2) ($)(3) ($)(4) ($)(5) ($)(6) ($)
(a) (b) (c) (d) (e) (f) (g) (h) (i)
David C. Novak 2011 1,474,038 — 773,024 5,807,028 4,541,400 7,507,185 309,177 20,411,852
Chairman, Chief 2010 1,400,000 — 740,005 5,029,877 5,066,880 2,038,361 338,783 14,613,906
Executive Officer 2009 1,400,000 — 739,989 4,192,111 2,993,760 3,565,977 239,455 13,131,292
and President
Richard T. Carucci 2011 810,769 — 235,013 2,621,573 1,566,000 4,764,483 18,798 10,016,636
Chief Financial 2010 715,000 — 225,023 1,387,559 1,589,445 361,071 58,213 4,336,311
Officer 2009 711,923 — 224,994 1,479,567 907,818 1,083,683 50,713 4,458,698
Jing-Shyh S. Su 2011 1,007,692 — 324,986 1,668,280 3,105,000 4,556,233 1,842,530 12,504,721
Vice Chairman, 2010 815,000 — 7,106,211 1,387,559 2,628,986 1,470,360 909,904 14,318,020
Yum! Brands, Inc. 2009 811,923 — 310,011 1,479,567 1,718,917 1,532,322 868,468 6,721,208
Chairman and
Chief Executive
Officer, YUM’s
China Division
Graham D. Allan 2011 898,558 — 320,006 1,429,951 2,015,145 2,006,951 21,750 6,692,361
Former Chief 2010 815,000 — 310,012 1,387,559 1,425,557 1,572,049 63,331 5,573,508
Executive Officer 2009 811,923 — 310,011 1,479,567 1,023,477 732,364 50,235 4,407,577
Yum! Restaurants
International(7)
Muktesh Pant 2011 644,231 — 169,986 2,418,782 1,110,038 — 308,786 4,651,823
Proxy Statement
Chief Executive
Officer, Yum!
Restaurants
International(7)
(1) The amounts reflect compensation for 53 weeks in 2011 compared to 52 weeks in fiscal 2009 and 2010 due to timing of fiscal period end.
Amounts shown are not reduced to reflect the NEOs’ elections, if any, to defer receipt of salary into the Executive Income Deferral
(‘‘EID’’) Program or into the Company’s 401(k) Plan.
(2) Amounts shown in this column represent the grant date fair values for performance share units (PSUs) granted in 2011, 2010, and 2009
and restricted stock units (RSUs) granted in 2010 under our Long Term Incentive Plan. Further information regarding the 2011 awards
is included in the ‘‘Grants of Plan-Based Awards’’ and ‘‘Outstanding Equity Awards at Fiscal Year-End’’ tables later in this proxy
statement. The grant date fair value of the PSUs reflected in this column is the target payout based on the probable outcome of the
performance condition, determined as of the grant date. The maximum potential values of the PSUs would be 200% of target. For 2011,
Mr. Novak’s PSU maximum value at grant date fair value would be $1,546,048; Mr. Carucci’s PSU maximum value would be $470,026;
Mr. Su’s PSU maximum value would be $649,972; Mr. Allan’s PSU maximum value would be $640,012; and Mr. Pant’s PSU maximum
value would be $339,972. In 2010, Mr. Su was the only NEO to receive an RSU grant. Mr. Su’s RSU grant vests after five years and
Mr. Su may not sell the shares until 12 months following retirement from the Company. The expense of Mr. Su’s award is recognized
over the vesting period.
(3) The amounts shown in this column represent the grant date fair values of the stock options and SARs awarded in 2011, 2010 and 2009,
respectively. For a discussion of the assumptions and methodologies used to value the awards reported in Column (d) and Column (e),
please see the discussion of stock awards and option awards contained in Part II, Item 8, ‘‘Financial Statements and Supplementary
Data’’ of the 2011 Annual Report in Notes to Consolidated Financial Statements at Note 15, ‘‘Share-based and Deferred Compensation
Plans.’’
(4) Amounts in column (f) reflect the annual incentive awards earned for the 2011, 2010 and 2009 fiscal year performance periods, which
were awarded by our Management Planning and Development Committee in January 2012, January 2011 and January 2010,
57