Pizza Hut 2011 Annual Report Download - page 171
Download and view the complete annual report
Please find page 171 of the 2011 Pizza Hut annual report below. You can navigate through the pages in the report by either clicking on the pages listed below, or by using the keyword search tool below to find specific information within the annual report.-
 1
1 -
2
-
3
-
4
-
5
-
6
-
7
-
8
-
9
-
10
-
11
-
12
-
13
-
14
-
15
-
16
-
17
-
18
-
19
-
20
-
21
-
22
-
23
-
24
-
25
-
26
-
27
-
28
-
29
-
30
-
31
-
32
-
33
-
34
-
35
-
36
-
37
-
38
-
39
-
40
-
41
-
42
-
43
-
44
-
45
-
46
-
47
-
48
-
49
-
50
-
51
-
52
-
53
-
54
-
55
-
56
-
57
-
58
-
59
-
60
-
61
-
62
-
63
-
64
-
65
-
66
-
67
-
68
-
69
-
70
-
71
-
72
-
73
-
74
-
75
-
76
-
77
-
78
-
79
-
80
-
81
-
82
-
83
-
84
-
85
-
86
-
87
-
88
-
89
-
90
-
91
-
92
-
93
-
94
-
95
-
96
-
97
-
98
-
99
-
100
-
101
-
102
-
103
-
104
-
105
-
106
-
107
-
108
-
109
-
110
-
111
-
112
-
113
-
114
-
115
-
116
-
117
-
118
-
119
-
120
-
121
-
122
-
123
-
124
-
125
-
126
-
127
-
128
-
129
-
130
-
131
-
132
-
133
-
134
-
135
-
136
-
137
-
138
-
139
-
140
-
141
-
142
-
143
-
144
-
145
-
146
-
147
-
148
-
149
-
150
-
151
-
152
-
153
-
154
-
155
-
156
-
157
-
158
-
159
-
160
-
 161
161 -
 162
162 -
 163
163 -
 164
164 -
 165
165 -
 166
166 -
 167
167 -
 168
168 -
 169
169 -
 170
170 -
 171
171 -
 172
172 -
 173
173 -
 174
174 -
 175
175 -
 176
176 -
 177
177 -
 178
178 -
 179
179 -
 180
180 -
 181
181 -
182
-
183
-
184
-
185
-
186
-
187
-
188
-
189
-
190
-
191
-
192
-
193
-
194
-
195
-
196
-
197
-
198
-
199
-
200
-
201
-
202
-
203
-
204
-
205
-
206
-
207
-
208
-
209
-
210
-
211
-
212
 |
 |

67
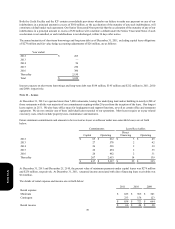
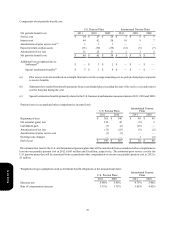
Depreciation and amortization expense related to property, plant and equipment was $599 million, $565 million and $553 million
in 2011, 2010 and 2009, respectively.
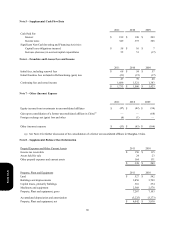
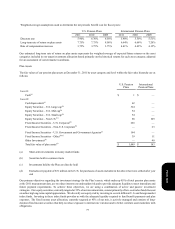
Accounts Payable and Other Current Liabilities
Accounts payable
Accrued capital expenditures
Accrued compensation and benefits
Dividends payable
Accrued taxes, other than income taxes
Other current liabilities
2011
$ 712
229
440
131
112
250
$ 1,874
2010
$ 540
174
357
118
95
318
$ 1,602
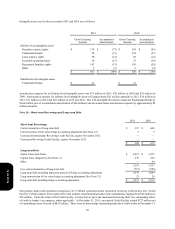
Note 9 – Goodwill and Intangible Assets
The changes in the carrying amount of goodwill are as follows:
Balance as of December 26, 2009
Goodwill, gross
Accumulated impairment losses
Goodwill, net
Acquisitions (a)
Disposals and other, net(b)
Balance as of December 25, 2010
Goodwill, gross
Accumulated impairment losses
Goodwill, net
Acquisitions(c)
Disposals and other, net(b)
Balance as of December 31, 2011(d)
Goodwill, gross
Accumulated impairment losses
Goodwill, net
China
$ 82
—
82
—
3
85
—
85
—
3
88
—
$ 88
YRI
$ 249
(17)
232
37
(17)
269
(17)
252
32
(2)
299
(17)
$ 282
U.S.
$ 352
(26)
326
—
(4)
348
(26)
322
—
(11)
311
—
$ 311
Worldwide
$ 683
(43)
640
37
(18)
702
(43)
659
32
(10)
698
(17)
$ 681
(a) We recorded goodwill in our YRI segment related to the July 1, 2010 exercise of our option with our Russian partner to
purchase their interest in the co-branded Rostik’s-KFC restaurants across Russia and the Commonwealth of Independent
States. See Note 4.
(b) Disposals and other, net includes the impact of foreign currency translation on existing balances and goodwill write-offs
associated with refranchising.
(c) We recorded goodwill in our YRI segment related to the acquisition of 68 stores in South Africa. See Note 4.
(d) As a result of the LJS and A&W divestitures in 2011, we disposed of $26 million of goodwill that was fully impaired in
2009.
Form 10-K