Pizza Hut 2011 Annual Report Download - page 127
Download and view the complete annual report
Please find page 127 of the 2011 Pizza Hut annual report below. You can navigate through the pages in the report by either clicking on the pages listed below, or by using the keyword search tool below to find specific information within the annual report.-
 1
1 -
2
-
3
-
4
-
5
-
6
-
7
-
8
-
9
-
10
-
11
-
12
-
13
-
14
-
15
-
16
-
17
-
18
-
19
-
20
-
21
-
22
-
23
-
24
-
25
-
26
-
27
-
28
-
29
-
30
-
31
-
32
-
33
-
34
-
35
-
36
-
37
-
38
-
39
-
40
-
41
-
42
-
43
-
44
-
45
-
46
-
47
-
48
-
49
-
50
-
51
-
52
-
53
-
54
-
55
-
56
-
57
-
58
-
59
-
60
-
61
-
62
-
63
-
64
-
65
-
66
-
67
-
68
-
69
-
70
-
71
-
72
-
73
-
74
-
75
-
76
-
77
-
78
-
79
-
80
-
81
-
82
-
83
-
84
-
85
-
86
-
87
-
88
-
89
-
90
-
91
-
92
-
93
-
94
-
95
-
96
-
97
-
98
-
99
-
100
-
101
-
102
-
103
-
104
-
105
-
106
-
107
-
108
-
109
-
110
-
111
-
112
-
113
-
114
-
115
-
116
-
 117
117 -
 118
118 -
 119
119 -
 120
120 -
 121
121 -
 122
122 -
 123
123 -
 124
124 -
 125
125 -
 126
126 -
 127
127 -
 128
128 -
 129
129 -
 130
130 -
 131
131 -
 132
132 -
 133
133 -
 134
134 -
 135
135 -
 136
136 -
 137
137 -
138
-
139
-
140
-
141
-
142
-
143
-
144
-
145
-
146
-
147
-
148
-
149
-
150
-
151
-
152
-
153
-
154
-
155
-
156
-
157
-
158
-
159
-
160
-
161
-
162
-
163
-
164
-
165
-
166
-
167
-
168
-
169
-
170
-
171
-
172
-
173
-
174
-
175
-
176
-
177
-
178
-
179
-
180
-
181
-
182
-
183
-
184
-
185
-
186
-
187
-
188
-
189
-
190
-
191
-
192
-
193
-
194
-
195
-
196
-
197
-
198
-
199
-
200
-
201
-
202
-
203
-
204
-
205
-
206
-
207
-
208
-
209
-
210
-
211
-
212
 |
 |

23
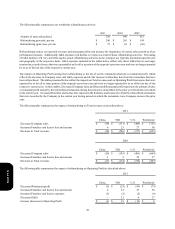
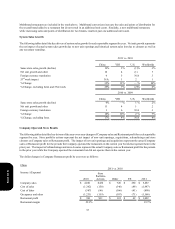
Results of Operations
Company sales
Franchise and license fees and income
Total revenues
Company restaurant profit
% of Company sales
Operating Profit
Interest expense, net
Income tax provision
Net Income – including noncontrolling interest
Net Income – noncontrolling interest
Net Income – YUM! Brands, Inc.
Diluted EPS(a)
Diluted EPS before Special Items(a)
Reported Effective tax rate
Effective tax rate before Special Items
Amount
2011
$ 10,893
1,733
$ 12,626
$ 1,753
16.1%
$ 1,815
156
324
1,335
16
$ 1,319
$ 2.74
$ 2.87
19.5%
24.2%
2010
$ 9,783
1,560
$ 11,343
$ 1,663
17.0%
$ 1,769
175
416
1,178
20
$ 1,158
$ 2.38
$ 2.53
26.1%
25.3%
2009
$ 9,413
1,423
$ 10,836
$ 1,479
15.7%
$ 1,590
194
313
1,083
12
$ 1,071
$ 2.22
$ 2.17
22.4%
23.1%
% B/(W)
2011
11
11
11
6
(0.9)
3
11
22
13
18
14
15
14
ppts.
2010
4
10
5
12
1.3
11
9
(33)
9
(60)
8
7
17
ppts.
(a) See Note 3 for the number of shares used in these calculations.
Significant Known Events, Trends or Uncertainties Impacting or Expected to Impact Comparisons of Reported or Future
Results
Special Items
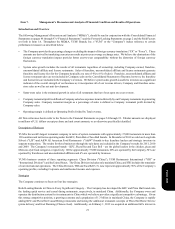
In addition to the results provided in accordance with U.S. Generally Accepted Accounting Principles (“GAAP”) above and
throughout this document, the Company has provided non-GAAP measurements which present operating results in 2011, 2010
and 2009 on a basis before Special Items. Included in Special Items are the impact of measures we took to transform our U.S.
business (“the U.S. business transformation measures”) including: U.S. refranchising gains (losses), the depreciation reduction
arising from the impairment of KFC restaurants we offered to sell in 2010 that remained Company restaurants for some or all of
the periods presented, charges relating to U.S. G&A productivity initiatives and realignment of resources, investments in our U.S.
Brands and a 2009 U.S. Goodwill impairment charge. Special Items also include losses and other costs related to the LJS and
A&W divestitures, the losses associated with refranchising equity markets outside the U.S., the depreciation reduction from the
impairment of Pizza Hut UK restaurants upon our decision to refranchise these restaurants in 2011 and the 2009 gain upon our
acquisition of additional ownership in, and consolidation of, the operating entity that owns the KFCs in Shanghai, China. These
amounts are further described below.
The Company uses earnings before Special Items as a key performance measure of results of operations for the purpose of evaluating
performance internally, and Special Items are not included in our China, YRI or U.S. segment results. This non-GAAP measurement
is not intended to replace the presentation of our financial results in accordance with GAAP. Rather, the Company believes that
the presentation of earnings before Special Items provides additional information to investors to facilitate the comparison of past
and present operations, excluding items in 2011, 2010 and 2009 that the Company does not believe are indicative of our ongoing
operations due to their size and/or nature.
Form 10-K