Pizza Hut 2011 Annual Report Download - page 132
Download and view the complete annual report
Please find page 132 of the 2011 Pizza Hut annual report below. You can navigate through the pages in the report by either clicking on the pages listed below, or by using the keyword search tool below to find specific information within the annual report.-
 1
1 -
2
-
3
-
4
-
5
-
6
-
7
-
8
-
9
-
10
-
11
-
12
-
13
-
14
-
15
-
16
-
17
-
18
-
19
-
20
-
21
-
22
-
23
-
24
-
25
-
26
-
27
-
28
-
29
-
30
-
31
-
32
-
33
-
34
-
35
-
36
-
37
-
38
-
39
-
40
-
41
-
42
-
43
-
44
-
45
-
46
-
47
-
48
-
49
-
50
-
51
-
52
-
53
-
54
-
55
-
56
-
57
-
58
-
59
-
60
-
61
-
62
-
63
-
64
-
65
-
66
-
67
-
68
-
69
-
70
-
71
-
72
-
73
-
74
-
75
-
76
-
77
-
78
-
79
-
80
-
81
-
82
-
83
-
84
-
85
-
86
-
87
-
88
-
89
-
90
-
91
-
92
-
93
-
94
-
95
-
96
-
97
-
98
-
99
-
100
-
101
-
102
-
103
-
104
-
105
-
106
-
107
-
108
-
109
-
110
-
111
-
112
-
113
-
114
-
115
-
116
-
117
-
118
-
119
-
120
-
121
-
 122
122 -
 123
123 -
 124
124 -
 125
125 -
 126
126 -
 127
127 -
 128
128 -
 129
129 -
 130
130 -
 131
131 -
 132
132 -
 133
133 -
 134
134 -
 135
135 -
 136
136 -
 137
137 -
 138
138 -
 139
139 -
 140
140 -
 141
141 -
 142
142 -
143
-
144
-
145
-
146
-
147
-
148
-
149
-
150
-
151
-
152
-
153
-
154
-
155
-
156
-
157
-
158
-
159
-
160
-
161
-
162
-
163
-
164
-
165
-
166
-
167
-
168
-
169
-
170
-
171
-
172
-
173
-
174
-
175
-
176
-
177
-
178
-
179
-
180
-
181
-
182
-
183
-
184
-
185
-
186
-
187
-
188
-
189
-
190
-
191
-
192
-
193
-
194
-
195
-
196
-
197
-
198
-
199
-
200
-
201
-
202
-
203
-
204
-
205
-
206
-
207
-
208
-
209
-
210
-
211
-
212
 |
 |

28
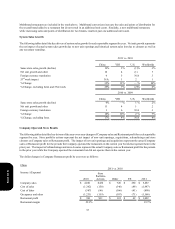
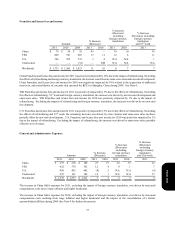
The following table summarizes our worldwide refranchising activities:
Number of units refranchised
Refranchising proceeds, pre-tax
Refranchising (gain) loss, pre-tax
2011
529
$ 246
$ 72
2010
949
$ 265
$ 63
2009
613
$ 194
$(26)
Refranchisings reduce our reported revenues and restaurant profits and increase the importance of system sales growth as a key
performance measure. Additionally, G&A expenses will decline over time as a result of these refranchising activities. The timing
of G&A declines will vary and often lag the actual refranchising activities as the synergies are typically dependent upon the size
and geography of the respective deals. G&A expenses included in the tables below reflect only direct G&A that we no longer
incurred as a result of stores that were operated by us for all or a portion of the respective previous year and were no longer operated
by us as of the last day of the respective current year.
The impact on Operating Profit arising from refranchising is the net of (a) the estimated reductions in restaurant profit, which
reflects the decrease in Company sales, and G&A expenses and (b) the increase in franchise fees from the restaurants that have
been refranchised. The tables presented below reflect the impacts on Total revenues and on Operating Profit from stores that were
operated by us for all or some portion of the respective previous year and were no longer operated by us as of the last day of the
respective current year. In these tables, Decreased Company sales and Decreased Restaurant profit represents the amount of sales
or restaurant profit earned by the refranchised restaurants during the period we owned them in the prior year but did not own them
in the current year. Increased Franchise and license fees represents the franchise and license fees from the refranchised restaurants
that were recorded by the Company in the current year during periods in which the restaurants were Company stores in the prior
year.
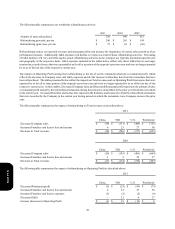
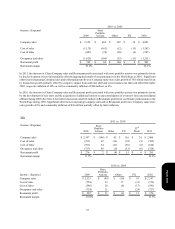
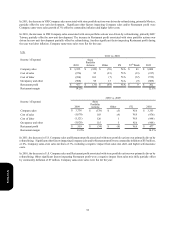
The following table summarizes the impact of refranchising on Total revenues as described above:
Decreased Company sales
Increased Franchise and license fees and income
Decrease in Total revenues
2011
China
$(36)
6
$(30)
YRI
$(311)
25
$(286)
U.S.
$(404)
27
$(377)
Worldwide
$(751)
58
$(693)
Decreased Company sales
Increased Franchise and license fees and income
Decrease in Total revenues
2010
China
$(20)
3
$(17)
YRI
$(183)
9
$(174)
U.S.
$(401)
25
$(376)
Worldwide
$(604)
37
$(567)
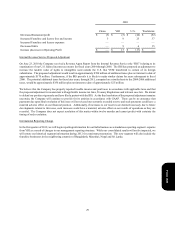
The following table summarizes the impact of refranchising on Operating Profit as described above:
Decreased Restaurant profit
Increased Franchise and license fees and income
Increased Franchise and license expenses
Decreased G&A
Increase (decrease) in Operating Profit
2011
China
$(5)
6
(2)
—
$(1)
YRI
$(25)
25
(2)
21
$ 19
U.S.
$(43)
27
(2)
6
$(12)
Worldwide
$(73)
58
(6)
27
$ 6
Form 10-K