Pizza Hut 2011 Annual Report Download - page 143
Download and view the complete annual report
Please find page 143 of the 2011 Pizza Hut annual report below. You can navigate through the pages in the report by either clicking on the pages listed below, or by using the keyword search tool below to find specific information within the annual report.-
 1
1 -
2
-
3
-
4
-
5
-
6
-
7
-
8
-
9
-
10
-
11
-
12
-
13
-
14
-
15
-
16
-
17
-
18
-
19
-
20
-
21
-
22
-
23
-
24
-
25
-
26
-
27
-
28
-
29
-
30
-
31
-
32
-
33
-
34
-
35
-
36
-
37
-
38
-
39
-
40
-
41
-
42
-
43
-
44
-
45
-
46
-
47
-
48
-
49
-
50
-
51
-
52
-
53
-
54
-
55
-
56
-
57
-
58
-
59
-
60
-
61
-
62
-
63
-
64
-
65
-
66
-
67
-
68
-
69
-
70
-
71
-
72
-
73
-
74
-
75
-
76
-
77
-
78
-
79
-
80
-
81
-
82
-
83
-
84
-
85
-
86
-
87
-
88
-
89
-
90
-
91
-
92
-
93
-
94
-
95
-
96
-
97
-
98
-
99
-
100
-
101
-
102
-
103
-
104
-
105
-
106
-
107
-
108
-
109
-
110
-
111
-
112
-
113
-
114
-
115
-
116
-
117
-
118
-
119
-
120
-
121
-
122
-
123
-
124
-
125
-
126
-
127
-
128
-
129
-
130
-
131
-
132
-
 133
133 -
 134
134 -
 135
135 -
 136
136 -
 137
137 -
 138
138 -
 139
139 -
 140
140 -
 141
141 -
 142
142 -
 143
143 -
 144
144 -
 145
145 -
 146
146 -
 147
147 -
 148
148 -
 149
149 -
 150
150 -
 151
151 -
 152
152 -
 153
153 -
154
-
155
-
156
-
157
-
158
-
159
-
160
-
161
-
162
-
163
-
164
-
165
-
166
-
167
-
168
-
169
-
170
-
171
-
172
-
173
-
174
-
175
-
176
-
177
-
178
-
179
-
180
-
181
-
182
-
183
-
184
-
185
-
186
-
187
-
188
-
189
-
190
-
191
-
192
-
193
-
194
-
195
-
196
-
197
-
198
-
199
-
200
-
201
-
202
-
203
-
204
-
205
-
206
-
207
-
208
-
209
-
210
-
211
-
212
 |
 |

39
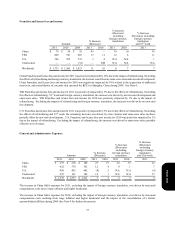
allowance additions related to capital losses recognized as a result of the LJS and A&W divestitures, which are presented within
Net Benefit from LJS and A&W divestitures.
In 2010, the $22 million of net tax expense was driven by $25 million for valuation allowances recorded against deferred tax assets
generated during the current year. This expense was partially offset by a $3 million tax benefit resulting from a change in judgment
regarding the future use of U.S. state deferred tax assets that existed at the beginning of the year.
In 2009, the $9 million net tax benefit was driven by $25 million of benefit resulting from a change in judgment regarding the
future use of foreign deferred tax assets that existed at the beginning of the year. This benefit was partially offset by $16 million
for valuation allowances recorded against deferred tax assets generated during the year.
Net benefit from LJS and A&W divestitures. This item includes a one-time $117 million tax benefit, including approximately $8
million state benefit, recognized on the LJS and A&W divestitures in 2011, partially offset by $45 million of valuation allowance,
including approximately $4 million state expense, related to capital loss carryforwards recognized as a result of the divestitures.
In addition, we recorded $32 million of tax benefits on $86 million of pre-tax losses and other costs which resulted in $104 million
of total net tax benefits related to the divestitures.
Other. This item primarily includes the impact of permanent differences related to current year earnings and U.S. tax credits.
In 2009, this item was positively impacted by a one-time pre-tax gain of approximately $68 million, with no related income tax
expense, recognized on our acquisition of additional interest in, and consolidation of, the entity that operates KFC in Shanghai,
China. This was partially offset by a pre-tax U.S. goodwill impairment charge of approximately $26 million, with no related
income tax benefit.
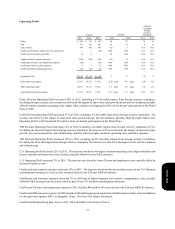
Consolidated Cash Flows
Net cash provided by operating activities was $2,170 million compared to $1,968 million in 2010. The increase was primarily
driven by higher operating profit before Special Items.
In 2010, net cash provided by operating activities was $1,968 million compared to $1,404 million in 2009. The increase was
primarily driven by higher operating profit before Special Items and decreased pension contributions.
Net cash used in investing activities was $1,006 million versus $579 million in 2010. The increase was driven by an increase
in Restricted cash and higher capital spending.
In 2010, net cash used in investing activities was $579 million versus $727 million in 2009. The decrease was driven by lapping
the 2009 acquisition of a non-controlling interest in Little Sheep, and increased proceeds from refranchising, partially offset by
the 2010 acquisition of our partner’s interest in Rostik’s-KFC. See Note 4 for further discussion.
Net cash used in financing activities was $1,413 million versus $337 million in 2010. The increase was driven by lower net
borrowings and an increase in share repurchases.
In 2010, net cash used in financing activities was $337 million versus $542 million in 2009. The decrease was driven by higher
net borrowings, partially offset by an increase in share repurchases.
Consolidated Financial Condition
The increase in Restricted cash was due to $300 million in funds placed in escrow which were restricted to the acquisition of an
additional 66% interest in Little Sheep. See Notes 4 and 21.
The decrease in Intangible assets was primarily due to the LJS and A&W divestitures. See Note 4.
The decrease in Short-term borrowings was primarily due to the maturity of $650 million of Senior Unsecured Notes in April
2011, offset by $263 million of Senior Unsecured Notes due in June 2012 being classified as short term as of December 31, 2011.
Liquidity and Capital Resources
Operating in the QSR industry allows us to generate substantial cash flows from the operations of our company stores and from
our extensive franchise operations which require a limited YUM investment. Net cash provided by operating activities has exceeded
$1 billion in each of the last ten fiscal years, including over $2 billion in 2011. We expect these levels of net cash provided by
Form 10-K