Pizza Hut 2011 Annual Report Download - page 155
Download and view the complete annual report
Please find page 155 of the 2011 Pizza Hut annual report below. You can navigate through the pages in the report by either clicking on the pages listed below, or by using the keyword search tool below to find specific information within the annual report.-
 1
1 -
2
-
3
-
4
-
5
-
6
-
7
-
8
-
9
-
10
-
11
-
12
-
13
-
14
-
15
-
16
-
17
-
18
-
19
-
20
-
21
-
22
-
23
-
24
-
25
-
26
-
27
-
28
-
29
-
30
-
31
-
32
-
33
-
34
-
35
-
36
-
37
-
38
-
39
-
40
-
41
-
42
-
43
-
44
-
45
-
46
-
47
-
48
-
49
-
50
-
51
-
52
-
53
-
54
-
55
-
56
-
57
-
58
-
59
-
60
-
61
-
62
-
63
-
64
-
65
-
66
-
67
-
68
-
69
-
70
-
71
-
72
-
73
-
74
-
75
-
76
-
77
-
78
-
79
-
80
-
81
-
82
-
83
-
84
-
85
-
86
-
87
-
88
-
89
-
90
-
91
-
92
-
93
-
94
-
95
-
96
-
97
-
98
-
99
-
100
-
101
-
102
-
103
-
104
-
105
-
106
-
107
-
108
-
109
-
110
-
111
-
112
-
113
-
114
-
115
-
116
-
117
-
118
-
119
-
120
-
121
-
122
-
123
-
124
-
125
-
126
-
127
-
128
-
129
-
130
-
131
-
132
-
133
-
134
-
135
-
136
-
137
-
138
-
139
-
140
-
141
-
142
-
143
-
144
-
 145
145 -
 146
146 -
 147
147 -
 148
148 -
 149
149 -
 150
150 -
 151
151 -
 152
152 -
 153
153 -
 154
154 -
 155
155 -
 156
156 -
 157
157 -
 158
158 -
 159
159 -
 160
160 -
 161
161 -
 162
162 -
 163
163 -
 164
164 -
 165
165 -
166
-
167
-
168
-
169
-
170
-
171
-
172
-
173
-
174
-
175
-
176
-
177
-
178
-
179
-
180
-
181
-
182
-
183
-
184
-
185
-
186
-
187
-
188
-
189
-
190
-
191
-
192
-
193
-
194
-
195
-
196
-
197
-
198
-
199
-
200
-
201
-
202
-
203
-
204
-
205
-
206
-
207
-
208
-
209
-
210
-
211
-
212
 |
 |

51
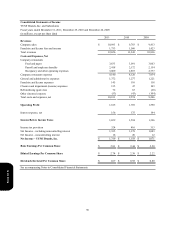
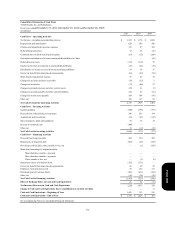
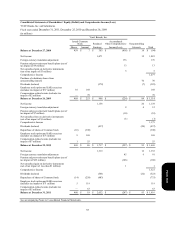
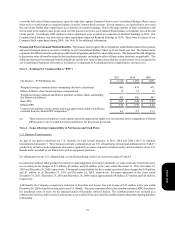
Consolidated Statements of Cash Flows
YUM! Brands, Inc. and Subsidiaries
Fiscal years ended December 31, 2011, December 25, 2010 and December 26, 2009
(in millions)
Cash Flows – Operating Activities
Net Income – including noncontrolling interest
Depreciation and amortization
Closures and impairment (income) expenses
Refranchising (gain) loss
Contributions to defined benefit pension plans
Gain upon consolidation of a former unconsolidated affiliate in China
Deferred income taxes
Equity income from investments in unconsolidated affiliates
Distributions of income received from unconsolidated affiliates
Excess tax benefit from share-based compensation
Share-based compensation expense
Changes in accounts and notes receivable
Changes in inventories
Changes in prepaid expenses and other current assets
Changes in accounts payable and other current liabilities
Changes in income taxes payable
Other, net
Net Cash Provided by Operating Activities
Cash Flows – Investing Activities
Capital spending
Proceeds from refranchising of restaurants
Acquisitions and investments
Sales of property, plant and equipment
Increase in restricted cash
Other, net
Net Cash Used in Investing Activities
Cash Flows – Financing Activities
Proceeds from long-term debt
Repayments of long-term debt
Revolving credit facilities, three months or less, net
Short-term borrowings by original maturity
More than three months – proceeds
More than three months – payments
Three months or less, net
Repurchase shares of Common Stock
Excess tax benefit from share-based compensation
Employee stock option proceeds
Dividends paid on Common Stock
Other, net
Net Cash Used in Financing Activities
Effect of Exchange Rates on Cash and Cash Equivalents
Net Increase (Decrease) in Cash and Cash Equivalents
Change in Cash and Cash Equivalents due to consolidation of an entity in China
Cash and Cash Equivalents – Beginning of Year
Cash and Cash Equivalents – End of Year
See accompanying Notes to Consolidated Financial Statements.
2011
$ 1,335
628
135
72
(63)
—
(137)
(47)
39
(66)
59
(39)
(75)
(25)
144
109
101
2,170
(940)
246
(81)
30
(300)
39
(1,006)
404
(666)
—
—
—
—
(752)
66
59
(481)
(43)
(1,413)
21
(228)
—
1,426
$ 1,198
2010
$ 1,178
589
47
63
(52)
—
(110)
(42)
34
(69)
47
(12)
(68)
61
61
104
137
1,968
(796)
265
(62)
33
—
(19)
(579)
350
(29)
(5)
—
—
(3)
(371)
69
102
(412)
(38)
(337)
21
1,073
—
353
$ 1,426
2009
$ 1,083
580
103
(26)
(280)
(68)
72
(36)
31
(59)
56
3
27
(7)
(62)
(95)
82
1,404
(797)
194
(139)
34
—
(19)
(727)
499
(528)
(295)
—
—
(8)
—
59
113
(362)
(20)
(542)
(15)
120
17
216
$ 353
Form 10-K