Pizza Hut 2011 Annual Report Download - page 149
Download and view the complete annual report
Please find page 149 of the 2011 Pizza Hut annual report below. You can navigate through the pages in the report by either clicking on the pages listed below, or by using the keyword search tool below to find specific information within the annual report.-
 1
1 -
2
-
3
-
4
-
5
-
6
-
7
-
8
-
9
-
10
-
11
-
12
-
13
-
14
-
15
-
16
-
17
-
18
-
19
-
20
-
21
-
22
-
23
-
24
-
25
-
26
-
27
-
28
-
29
-
30
-
31
-
32
-
33
-
34
-
35
-
36
-
37
-
38
-
39
-
40
-
41
-
42
-
43
-
44
-
45
-
46
-
47
-
48
-
49
-
50
-
51
-
52
-
53
-
54
-
55
-
56
-
57
-
58
-
59
-
60
-
61
-
62
-
63
-
64
-
65
-
66
-
67
-
68
-
69
-
70
-
71
-
72
-
73
-
74
-
75
-
76
-
77
-
78
-
79
-
80
-
81
-
82
-
83
-
84
-
85
-
86
-
87
-
88
-
89
-
90
-
91
-
92
-
93
-
94
-
95
-
96
-
97
-
98
-
99
-
100
-
101
-
102
-
103
-
104
-
105
-
106
-
107
-
108
-
109
-
110
-
111
-
112
-
113
-
114
-
115
-
116
-
117
-
118
-
119
-
120
-
121
-
122
-
123
-
124
-
125
-
126
-
127
-
128
-
129
-
130
-
131
-
132
-
133
-
134
-
135
-
136
-
137
-
138
-
 139
139 -
 140
140 -
 141
141 -
 142
142 -
 143
143 -
 144
144 -
 145
145 -
 146
146 -
 147
147 -
 148
148 -
 149
149 -
 150
150 -
 151
151 -
 152
152 -
 153
153 -
 154
154 -
 155
155 -
 156
156 -
 157
157 -
 158
158 -
 159
159 -
160
-
161
-
162
-
163
-
164
-
165
-
166
-
167
-
168
-
169
-
170
-
171
-
172
-
173
-
174
-
175
-
176
-
177
-
178
-
179
-
180
-
181
-
182
-
183
-
184
-
185
-
186
-
187
-
188
-
189
-
190
-
191
-
192
-
193
-
194
-
195
-
196
-
197
-
198
-
199
-
200
-
201
-
202
-
203
-
204
-
205
-
206
-
207
-
208
-
209
-
210
-
211
-
212
 |
 |

45
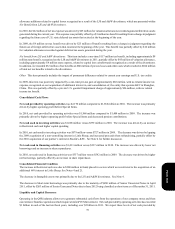
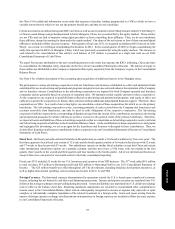
when we remain contingently liable. The fair value of a guarantee is the estimated amount at which the liability could be settled
in a current transaction between willing unrelated parties.
The present value of the minimum payments of the assigned leases, discounted at our pre-tax cost of debt, is approximately $550
million, at December 31, 2011. Current franchisees are the primary lessees under the vast majority of these leases. Additionally,
we have guaranteed approximately $17 million of franchisee loans for various programs. We generally have cross-default
provisions with these franchisees that would put them in default of their franchise agreement in the event of non-payment under
assigned leases and certain of the loan programs. We believe these cross-default provisions significantly reduce the risk that we
will be required to make payments under these guarantees and, historically, we have not been required to make significant payments
for guarantees. If payment on these guarantees becomes probable and estimable, we record a liability for our exposure under these
guarantees. At December 31, 2011 we have recorded an immaterial liability for our exposure under these guarantees which we
consider to be probable and estimable. If we begin to be required to perform under these guarantees to a greater extent, our results
of operations could be negatively impacted.
See Note 2 for a further discussion of our policies regarding franchise and license operations.
See Note 19 for a further discussion of our guarantees.
Self-Insured Property and Casualty Losses
We record our best estimate of the remaining cost to settle incurred self-insured workers' compensation, employment practices
liability, general liability, automobile liability, product liability and property losses (collectively "property and casualty
losses"). The estimate is based on the results of an independent actuarial study and considers historical claim frequency and
severity as well as changes in factors such as our business environment, benefit levels, medical costs and the regulatory environment
that could impact overall self-insurance costs. Additionally, our reserve includes a risk margin to cover unforeseen events that
may occur over the several years required to settle claims, increasing our confidence level that the recorded reserve is adequate.
See Note 19 for a further discussion of our insurance programs.
Pension Plans
Certain of our employees are covered under defined benefit pension plans. The most significant of these plans are in the U.S. We
have recorded the under-funded status of $383 million for these U.S. plans as a pension liability in our Consolidated Balance Sheet
as of December 31, 2011. These U.S. plans had a projected benefit obligation (“PBO”) of $1,381 million and a fair value of plan
assets of $998 million at December 31, 2011.
The PBO reflects the actuarial present value of all benefits earned to date by employees and incorporates assumptions as to future
compensation levels. Due to the relatively long time frame over which benefits earned to date are expected to be paid, our PBOs
are highly sensitive to changes in discount rates. For our U.S. plans, we measured our PBO using a discount rate of 4.90% at
December 31, 2011. This discount rate was determined with the assistance of our independent actuary. The primary basis for our
discount rate determination is a model that consists of a hypothetical portfolio of ten or more corporate debt instruments rated Aa
or higher by Moody’s with cash flows that mirror our expected benefit payment cash flows under the plan. We excluded from the
model those corporate debt instruments flagged by Moody’s for a potential downgrade and bonds with yields that were two standard
deviations or more above the mean. In considering possible bond portfolios, the model allows the bond cash flows for a particular
year to exceed the expected benefit cash flows for that year. Such excesses are assumed to be reinvested at appropriate one-year
forward rates and used to meet the benefit payment cash flows in a future year. The weighted-average yield of this hypothetical
portfolio was used to arrive at an appropriate discount rate. We also ensure that changes in the discount rate as compared to the
prior year are consistent with the overall change in prevailing market rates and make adjustments as necessary. A 50 basis-point
increase in this discount rate would have decreased our U.S. plans’ PBO by approximately $107 million at our measurement
date. Conversely, a 50 basis-point decrease in this discount rate would have increased our U.S. plans’ PBO by approximately
$121 million at our measurement date.
The pension expense we will record in 2012 is also impacted by the discount rate we selected at our measurement date. We expect
pension expense for our U.S. plans to increase approximately $36 million in 2012. The increase is primarily driven by an increase
in amortization of net loss due to a decrease in the discount rate. A 50 basis-point change in our discount rate assumption at our
measurement date would impact our 2012 U.S. pension expense by approximately $17 million.
The assumption we make regarding our expected long-term rates of return on plan assets also impacts our pension expense. Our
estimated long-term rate of return on U.S. plan assets represents the weighted-average of historical returns for each asset category,
Form 10-K