Pizza Hut 2011 Annual Report Download - page 59
Download and view the complete annual report
Please find page 59 of the 2011 Pizza Hut annual report below. You can navigate through the pages in the report by either clicking on the pages listed below, or by using the keyword search tool below to find specific information within the annual report.-
 1
1 -
2
-
3
-
4
-
5
-
6
-
7
-
8
-
9
-
10
-
11
-
12
-
13
-
14
-
15
-
16
-
17
-
18
-
19
-
20
-
21
-
22
-
23
-
24
-
25
-
26
-
27
-
28
-
29
-
30
-
31
-
32
-
33
-
34
-
35
-
36
-
37
-
38
-
39
-
40
-
41
-
42
-
43
-
44
-
45
-
46
-
47
-
48
-
 49
49 -
 50
50 -
 51
51 -
 52
52 -
 53
53 -
 54
54 -
 55
55 -
 56
56 -
 57
57 -
 58
58 -
 59
59 -
 60
60 -
 61
61 -
 62
62 -
 63
63 -
 64
64 -
 65
65 -
 66
66 -
 67
67 -
 68
68 -
 69
69 -
70
-
71
-
72
-
73
-
74
-
75
-
76
-
77
-
78
-
79
-
80
-
81
-
82
-
83
-
84
-
85
-
86
-
87
-
88
-
89
-
90
-
91
-
92
-
93
-
94
-
95
-
96
-
97
-
98
-
99
-
100
-
101
-
102
-
103
-
104
-
105
-
106
-
107
-
108
-
109
-
110
-
111
-
112
-
113
-
114
-
115
-
116
-
117
-
118
-
119
-
120
-
121
-
122
-
123
-
124
-
125
-
126
-
127
-
128
-
129
-
130
-
131
-
132
-
133
-
134
-
135
-
136
-
137
-
138
-
139
-
140
-
141
-
142
-
143
-
144
-
145
-
146
-
147
-
148
-
149
-
150
-
151
-
152
-
153
-
154
-
155
-
156
-
157
-
158
-
159
-
160
-
161
-
162
-
163
-
164
-
165
-
166
-
167
-
168
-
169
-
170
-
171
-
172
-
173
-
174
-
175
-
176
-
177
-
178
-
179
-
180
-
181
-
182
-
183
-
184
-
185
-
186
-
187
-
188
-
189
-
190
-
191
-
192
-
193
-
194
-
195
-
196
-
197
-
198
-
199
-
200
-
201
-
202
-
203
-
204
-
205
-
206
-
207
-
208
-
209
-
210
-
211
-
212
 |
 |

16MAR201218542623
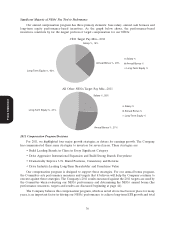
For our NEOs (other than the CEO), the mix of total compensation is effectively targeted at 30%
fixed and 70% variable. Fixed compensation is comprised of base salary, while variable compensation is
comprised of annual bonus and long-term incentive compensation.
Role of Independent Consultant
The Committee’s charter states that the Committee may retain outside compensation consultants,
lawyers or other advisors. Since 2005, the Committee has retained an independent consultant, Meridian
Compensation Partners, LLC (‘‘Meridian’’), to advise it on certain compensation matters. For 2011 and
similar to prior years, the Committee told Meridian that:
• they were to act independently of management and at the direction of the Committee;
• their ongoing engagement would be determined by the Committee;
• they were to inform the Committee of relevant trends and regulatory developments; and
• they were to provide compensation comparisons based on information that is derived from
comparable businesses of a similar size to us for the CEO and other NEOs and assist the
Committee in its determination of the annual compensation package for our CEO.
During 2011, Meridian did not provide any services to the Company unrelated to executive
compensation.
Role of Comparative Compensation Data
One of the factors used by our Committee in setting executive compensation is an evaluation of how
our compensation levels compare to compensation levels for similarly situated executives at companies
considered to be our peers. To conduct these comparisons, Meridian provided compensation comparisons
based on information that is derived from comparable businesses. This data is used as a frame of reference
(a ‘‘benchmark’’) for establishing compensation targets for base salary, annual bonus and long-term
incentives for NEOs below our CEO.
The Committee uses a benchmark as a point of reference for measurement. Benchmarks, however,
Proxy Statement
are not the determinative factor for our NEOs’ compensation, and they do not supplant the analyses of the
individual performance of the NEOs. Because the comparative compensation information is one of several
factors used in the setting of executive compensation, the Committee has discretion in determining the
nature and extent of its use. Further, given the limitations associated with comparative pay information for
setting individual executive compensation, the Committee may elect not to use the comparative
compensation information at all in the course of making specific compensation decisions.
For our NEOs, other than our CEO, the Committee has set separate target percentiles for base salary,
performance-based annual bonuses and long-term incentives as discussed at page 43. The Committee does
not set target percentiles with respect to target total compensation for our NEOs other than our CEO (see
page 49 for a discussion of Mr. Novak’s target total compensation). For the CEO, the Company generally
attempts to deliver pay opportunities at the 75th percentile of the market—specifically, 75th percentile
target total cash and target total compensation. For all our NEOs, the Company does not measure/
benchmark the percentile ranking of compensation actually earned since any realized value from our
variable pay programs in particular is a function of company, division, and/or individual performance. It is
not generally the objective of the Company to deliver comparable pay outcomes but rather comparable pay
opportunities. Realized/earned value from the Company variable pay programs is reflective of business
results and not competitive benchmarking.
41