Pizza Hut 2011 Annual Report Download - page 183
Download and view the complete annual report
Please find page 183 of the 2011 Pizza Hut annual report below. You can navigate through the pages in the report by either clicking on the pages listed below, or by using the keyword search tool below to find specific information within the annual report.-
 1
1 -
2
-
3
-
4
-
5
-
6
-
7
-
8
-
9
-
10
-
11
-
12
-
13
-
14
-
15
-
16
-
17
-
18
-
19
-
20
-
21
-
22
-
23
-
24
-
25
-
26
-
27
-
28
-
29
-
30
-
31
-
32
-
33
-
34
-
35
-
36
-
37
-
38
-
39
-
40
-
41
-
42
-
43
-
44
-
45
-
46
-
47
-
48
-
49
-
50
-
51
-
52
-
53
-
54
-
55
-
56
-
57
-
58
-
59
-
60
-
61
-
62
-
63
-
64
-
65
-
66
-
67
-
68
-
69
-
70
-
71
-
72
-
73
-
74
-
75
-
76
-
77
-
78
-
79
-
80
-
81
-
82
-
83
-
84
-
85
-
86
-
87
-
88
-
89
-
90
-
91
-
92
-
93
-
94
-
95
-
96
-
97
-
98
-
99
-
100
-
101
-
102
-
103
-
104
-
105
-
106
-
107
-
108
-
109
-
110
-
111
-
112
-
113
-
114
-
115
-
116
-
117
-
118
-
119
-
120
-
121
-
122
-
123
-
124
-
125
-
126
-
127
-
128
-
129
-
130
-
131
-
132
-
133
-
134
-
135
-
136
-
137
-
138
-
139
-
140
-
141
-
142
-
143
-
144
-
145
-
146
-
147
-
148
-
149
-
150
-
151
-
152
-
153
-
154
-
155
-
156
-
157
-
158
-
159
-
160
-
161
-
162
-
163
-
164
-
165
-
166
-
167
-
168
-
169
-
170
-
171
-
172
-
 173
173 -
 174
174 -
 175
175 -
 176
176 -
 177
177 -
 178
178 -
 179
179 -
 180
180 -
 181
181 -
 182
182 -
 183
183 -
 184
184 -
 185
185 -
 186
186 -
 187
187 -
 188
188 -
 189
189 -
 190
190 -
 191
191 -
 192
192 -
 193
193 -
194
-
195
-
196
-
197
-
198
-
199
-
200
-
201
-
202
-
203
-
204
-
205
-
206
-
207
-
208
-
209
-
210
-
211
-
212
 |
 |

79
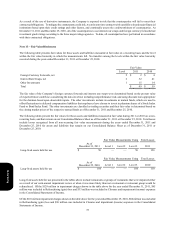
Note 15 – Share-based and Deferred Compensation Plans
Overview
At year end 2011, we had four stock award plans in effect: the YUM! Brands, Inc. Long-Term Incentive Plan and the 1997 Long-
Term Incentive Plan (collectively the “LTIPs”), the YUM! Brands, Inc. Restaurant General Manager Stock Option Plan (“RGM
Plan”) and the YUM! Brands, Inc. SharePower Plan (“SharePower”). Under all our plans, the exercise price of stock options and
stock appreciation rights (“SARs”) granted must be equal to or greater than the average market price or the ending market price
of the Company’s stock on the date of grant.
Potential awards to employees and non-employee directors under the LTIPs include stock options, incentive stock options, SARs,
restricted stock, stock units, restricted stock units (“RSUs”), performance restricted stock units, performance share units (“PSUs”)
and performance units. Through December 31, 2011, we have issued only stock options, SARs, RSUs and PSUs under the
LTIPs. While awards under the LTIPs can have varying vesting provisions and exercise periods, outstanding awards under the
LTIPs vest in periods ranging from immediate to 5 years. Stock options and SARs expire ten years after grant.
Potential awards to employees under the RGM Plan include stock options, SARs, restricted stock and RSUs. Through
December 31, 2011, we have issued only stock options and SARs under this plan. RGM Plan awards granted have a four-year
cliff vesting period and expire ten years after grant. Certain RGM Plan awards are granted upon attainment of performance
conditions in the previous year. Expense for such awards is recognized over a period that includes the performance condition
period.
Potential awards to employees under SharePower include stock options, SARs, restricted stock and RSUs. Through December 31,
2011, we have issued only stock options and SARs under this plan. These awards generally vest over a period of four years and
expire no longer than ten years after grant.
At year end 2011, approximately 19 million shares were available for future share-based compensation grants under the above
plans.
Our Executive Income Deferral (“EID”) Plan allows participants to defer receipt of a portion of their annual salary and all or a
portion of their incentive compensation. As defined by the EID Plan, we credit the amounts deferred with earnings based on the
investment options selected by the participants. These investment options are limited to cash, phantom shares of our Common
Stock, phantom shares of a Stock Index Fund and phantom shares of a Bond Index Fund. Investments in cash and phantom shares
of both index funds will be distributed in cash at a date as elected by the employee and therefore are classified as a liability on
our Consolidated Balance Sheets. We recognize compensation expense for the appreciation or the depreciation, if any, of
investments in cash and both of the index funds. Deferrals into the phantom shares of our Common Stock will be distributed in
shares of our Common Stock, under the LTIPs, at a date as elected by the employee and therefore are classified in Common Stock
on our Consolidated Balance Sheets. We do not recognize compensation expense for the appreciation or the depreciation, if any,
of investments in phantom shares of our Common Stock. Our EID plan also allows participants to defer incentive compensation
to purchase phantom shares of our Common Stock and receive a 33% Company match on the amount deferred. Deferrals receiving
a match are similar to a RSU award in that participants will generally forfeit both the match and incentive compensation amounts
deferred if they voluntarily separate from employment during a vesting period that is two years. We expense the intrinsic value
of the match and the incentive compensation over the requisite service period which includes the vesting period.
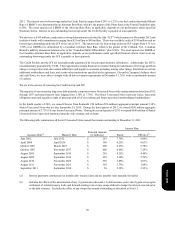
Historically, the Company has repurchased shares on the open market in excess of the amount necessary to satisfy award exercises
and expects to continue to do so in 2012.
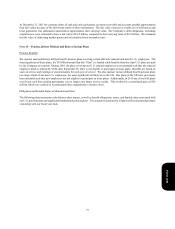
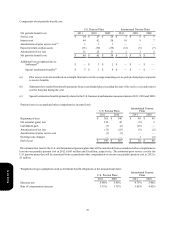
Award Valuation
We estimated the fair value of each stock option and SAR award as of the date of grant using the Black-Scholes option-pricing
model with the following weighted-average assumptions:
Risk-free interest rate
Expected term (years)
Expected volatility
Expected dividend yield
2011
2.0%
5.9
28.2%
2.0%
2010
2.4%
6.0
30.0%
2.5%
2009
1.9%
5.9
32.3%
2.6%
Form 10-K