MasterCard 2008 Annual Report Download - page 66
Download and view the complete annual report
Please find page 66 of the 2008 MasterCard annual report below. You can navigate through the pages in the report by either clicking on the pages listed below, or by using the keyword search tool below to find specific information within the annual report.-
 1
1 -
2
-
3
-
4
-
5
-
6
-
7
-
8
-
9
-
10
-
11
-
12
-
13
-
14
-
15
-
16
-
17
-
18
-
19
-
20
-
21
-
22
-
23
-
24
-
25
-
26
-
27
-
28
-
29
-
30
-
31
-
32
-
33
-
34
-
35
-
36
-
37
-
38
-
39
-
40
-
41
-
42
-
43
-
44
-
45
-
46
-
47
-
48
-
49
-
50
-
51
-
52
-
53
-
54
-
55
-
 56
56 -
 57
57 -
 58
58 -
 59
59 -
 60
60 -
 61
61 -
 62
62 -
 63
63 -
 64
64 -
 65
65 -
 66
66 -
 67
67 -
 68
68 -
 69
69 -
 70
70 -
 71
71 -
 72
72 -
 73
73 -
 74
74 -
 75
75 -
 76
76 -
77
-
78
-
79
-
80
-
81
-
82
-
83
-
84
-
85
-
86
-
87
-
88
-
89
-
90
-
91
-
92
-
93
-
94
-
95
-
96
-
97
-
98
-
99
-
100
-
101
-
102
-
103
-
104
-
105
-
106
-
107
-
108
-
109
-
110
-
111
-
112
-
113
-
114
-
115
-
116
-
117
-
118
-
119
-
120
-
121
-
122
-
123
-
124
-
125
-
126
-
127
-
128
-
129
-
130
-
131
-
132
-
133
-
134
-
135
-
136
-
137
-
138
-
139
-
140
-
141
-
142
-
143
-
144
-
145
-
146
-
147
-
148
-
149
-
150
-
151
-
152
-
153
-
154
-
155
-
156
-
157
-
158
-
159
-
160
 |
 |

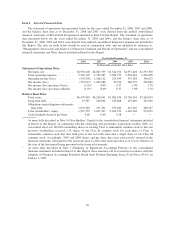
• Other operations fees represent various revenue streams, including cardholder services, compliance and
penalty fees, holograms, user pay for a variety of account and transaction enhancement services, and
manuals and publications. Significant components of the increase in other operations fees were as follows:
• Our account enhancement program, implemented in the second quarter of 2007, coupled with
increased usage resulted in revenue increases of $36 million and $24 million in 2008 and 2007,
respectively.
• Pricing for retail purchases in the U.S. by non-U.S. cardholders increased in January 2008. This
price increase, coupled with an increase in retail purchase volumes, resulted in a revenue increase of
$44 million in 2008.
• Cardholder services increased $21 million and $7 million in 2008 and 2007, respectively, due to an
increase in affluent account growth.
• Rebates relating to operations fees are primarily based on transactions and volumes and, accordingly,
increase as these variables increase. Rebates also have been increasing due to ongoing consolidation of our
customers and the impact of restructured pricing. Rebates as a percentage of gross operations fees were
8.7%, 10.0% and 9.6% in 2008, 2007 and 2006, respectively. During 2008, MasterCard had reduced rebates
for certain customers that did not achieve contractual performance hurdles. Accordingly, these reductions in
rebates decreased rebates as a percentage of gross operations fees.
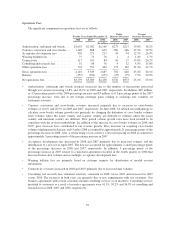
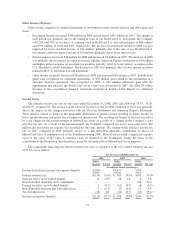
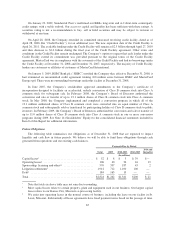
Assessments
Assessments are revenues that are calculated based on our customers’ GDV. The components of
assessments are as follows:
For the Years Ended December 31,
Dollar
Increase (Decrease)
Percent
Increase (Decrease)
2008 2007 2006 2008 2007 2008 2007
(In millions, except percentages)
Gross assessments ................ $2,345 $2,056 $1,790 $ 289 $266 14.1% 14.9%
Rebates and incentives ............. (1,112) (992) (894) (120) (98) 12.1% 11.0%
Net assessments .................. $1,233 $1,064 $ 896 $ 169 $168 15.9% 18.8%
Gross assessments grew partially due to GDV growth of approximately 10.7% and 14.4% in 2008 and 2007,
respectively, when measured in local currency terms and 11.5% and 18.4%, respectively, when measured on a
U.S. dollar converted basis. Assessment revenues are impacted by the overall strengthening or weakening of the
U.S. dollar and euro compared to the foreign currencies of the related local volumes in each period. In October
2008, we increased certain assessment fees and introduced a new assessment fee to acquirers in Europe. These
price changes in October 2008 contributed approximately 2 percentage points of the percentage increase in 2008.
In 2007, gross assessments also grew due to an increase in assessable volumes for market development programs
in specific countries within Europe. In addition, revenue growth rates in 2007 were impacted by a reclassification
of $31 million from assessments to currency conversion and cross-border revenues, offset by $12 million in
pricing increases related to our April 2006 SEPA pricing changes. The increase in 2007 gross assessments,
excluding the impact of the reclassifications and the pricing increase, would have been 11.3%.
Rebates and incentives are primarily based on GDV but may also contain components for the issuance of
new cards, launch of new programs or the execution of marketing programs. The rebates and incentives are
recorded as a reduction of gross revenue in the same period that performance occurs. Rebates and incentives as a
percentage of gross assessments were 47.4%, 48.2% and 49.9% in 2008, 2007 and 2006, respectively. Rebates
and incentives increased during 2008 and 2007 due to new and renewals of customer agreements and increased
volumes for certain merchants. However, the increase in 2008 was partially offset by reductions of rebates and
incentives for certain customers that did not achieve contractual performance hurdles. These reductions in rebates
56