MasterCard 2008 Annual Report Download - page 65
Download and view the complete annual report
Please find page 65 of the 2008 MasterCard annual report below. You can navigate through the pages in the report by either clicking on the pages listed below, or by using the keyword search tool below to find specific information within the annual report.-
 1
1 -
2
-
3
-
4
-
5
-
6
-
7
-
8
-
9
-
10
-
11
-
12
-
13
-
14
-
15
-
16
-
17
-
18
-
19
-
20
-
21
-
22
-
23
-
24
-
25
-
26
-
27
-
28
-
29
-
30
-
31
-
32
-
33
-
34
-
35
-
36
-
37
-
38
-
39
-
40
-
41
-
42
-
43
-
44
-
45
-
46
-
47
-
48
-
49
-
50
-
51
-
52
-
53
-
54
-
 55
55 -
 56
56 -
 57
57 -
 58
58 -
 59
59 -
 60
60 -
 61
61 -
 62
62 -
 63
63 -
 64
64 -
 65
65 -
 66
66 -
 67
67 -
 68
68 -
 69
69 -
 70
70 -
 71
71 -
 72
72 -
 73
73 -
 74
74 -
 75
75 -
76
-
77
-
78
-
79
-
80
-
81
-
82
-
83
-
84
-
85
-
86
-
87
-
88
-
89
-
90
-
91
-
92
-
93
-
94
-
95
-
96
-
97
-
98
-
99
-
100
-
101
-
102
-
103
-
104
-
105
-
106
-
107
-
108
-
109
-
110
-
111
-
112
-
113
-
114
-
115
-
116
-
117
-
118
-
119
-
120
-
121
-
122
-
123
-
124
-
125
-
126
-
127
-
128
-
129
-
130
-
131
-
132
-
133
-
134
-
135
-
136
-
137
-
138
-
139
-
140
-
141
-
142
-
143
-
144
-
145
-
146
-
147
-
148
-
149
-
150
-
151
-
152
-
153
-
154
-
155
-
156
-
157
-
158
-
159
-
160
 |
 |

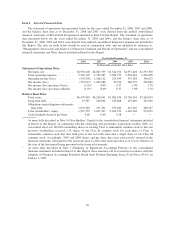
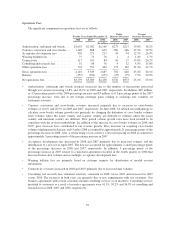
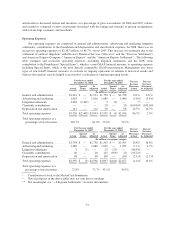
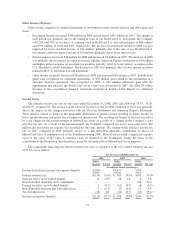
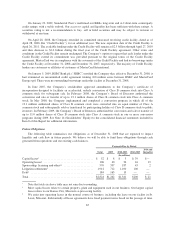
Operations Fees
The significant components in operations fees are as follows:
For the Years Ended December 31,
Dollar
Increase (Decrease)
Percent
Increase (Decrease)
2008 2007 2006 2008 2007 2008 2007
(In millions, except percentages)
Authorization, settlement and switch .... $1,655 $1,382 $1,169 $273 $213 19.8% 18.2%
Currency conversion and cross border . . . 1,148 868 622 280 246 32.3% 39.5%
Acceptance development fees ......... 305 271 217 34 54 12.5% 24.9%
Warning bulletin fees ................ 75 74 70 1 4 1.4% 5.7%
Connectivity ....................... 117 101 84 16 17 15.8% 20.2%
Consulting and research fees .......... 92 88 76 4 12 4.5% 15.8%
Other operations fees ................ 724 551 449 173 102 31.4% 22.7%
Gross operations fees ................ 4,116 3,335 2,687 781 648 23.4% 24.1%
Rebates ........................... (357) (332) (257) (25) (75) 7.5% 29.2%
Net operations fees .................. $3,759 $3,003 $2,430 $756 $573 25.2% 23.6%
• Authorization, settlement and switch revenues increased due to the number of transactions processed
through our systems increasing 11.8% and 16.2% in 2008 and 2007, respectively. In addition, $49 million,
or 3.5 percentage points of the 2008 percentage increase and $3 million, or 0.3 percentage points of the 2007
percentage increase, were due to net foreign exchange gains relating to exchange rate volatility on
settlement activities.
• Currency conversion and cross-border revenues increased primarily due to increases in cross-border
volumes of 16.6% and 20.9% in 2008 and 2007, respectively. In June 2008, we refined our methodology to
calculate cross-border volume growth rates primarily by changing the definition of cross border volumes
from volumes where the issuer country and acquirer country are different to volumes where the issuer
country and merchant country are different. Prior period volume growth rates have been restated to be
consistent with the revised methodology. In addition to the increase in cross-border volumes in 2008 and
2007, price increases have contributed to our revenue growth. Price increases on acquiring cross-border
volumes implemented in January and October 2008 accounted for approximately 21 percentage points of the
percentage increase in 2008. Also, a restructuring of our currency conversion pricing in 2006 accounted for
approximately 5 percentage points of the percentage increase in 2007.
• Acceptance development fees increased in 2008 and 2007 primarily due to increased volumes and the
introduction of a new fee in April 2007. The new fee accounted for approximately 2 and 8 percentage points
of the percentage increases in 2008 and 2007, respectively. In addition, 3 percentage points of the
percentage increase in 2007 related to a merchant agreement executed in the fourth quarter of 2006 that
increased transaction volumes and accordingly, acceptance development fees.
• Warning bulletin fees are primarily based on customer requests for distribution of invalid account
information.
• Connectivity revenues increased in 2008 and 2007 primarily due to increased data volumes.
• Consulting and research fees remained relatively consistent in 2008 versus 2007 and increased in 2007
versus 2006. The increases in both years are primarily due to new engagements with our customers. Our
business agreements with certain customers include consulting services as an incentive. Consulting services
provided to customers as a result of incentive agreements were 61.5%, 38.2% and 36.9% of consulting and
research fees in 2008, 2007 and 2006, respectively.
55