MasterCard 2008 Annual Report Download - page 105
Download and view the complete annual report
Please find page 105 of the 2008 MasterCard annual report below. You can navigate through the pages in the report by either clicking on the pages listed below, or by using the keyword search tool below to find specific information within the annual report.-
 1
1 -
2
-
3
-
4
-
5
-
6
-
7
-
8
-
9
-
10
-
11
-
12
-
13
-
14
-
15
-
16
-
17
-
18
-
19
-
20
-
21
-
22
-
23
-
24
-
25
-
26
-
27
-
28
-
29
-
30
-
31
-
32
-
33
-
34
-
35
-
36
-
37
-
38
-
39
-
40
-
41
-
42
-
43
-
44
-
45
-
46
-
47
-
48
-
49
-
50
-
51
-
52
-
53
-
54
-
55
-
56
-
57
-
58
-
59
-
60
-
61
-
62
-
63
-
64
-
65
-
66
-
67
-
68
-
69
-
70
-
71
-
72
-
73
-
74
-
75
-
76
-
77
-
78
-
79
-
80
-
81
-
82
-
83
-
84
-
85
-
86
-
87
-
88
-
89
-
90
-
91
-
92
-
93
-
94
-
 95
95 -
 96
96 -
 97
97 -
 98
98 -
 99
99 -
 100
100 -
 101
101 -
 102
102 -
 103
103 -
 104
104 -
 105
105 -
 106
106 -
 107
107 -
 108
108 -
 109
109 -
 110
110 -
 111
111 -
 112
112 -
 113
113 -
 114
114 -
 115
115 -
116
-
117
-
118
-
119
-
120
-
121
-
122
-
123
-
124
-
125
-
126
-
127
-
128
-
129
-
130
-
131
-
132
-
133
-
134
-
135
-
136
-
137
-
138
-
139
-
140
-
141
-
142
-
143
-
144
-
145
-
146
-
147
-
148
-
149
-
150
-
151
-
152
-
153
-
154
-
155
-
156
-
157
-
158
-
159
-
160
 |
 |

MASTERCARD INCORPORATED
NOTES TO CONSOLIDATED FINANCIAL STATEMENTS—(Continued)
(In thousands, except percent and per share data)
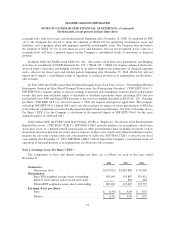
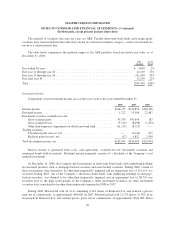
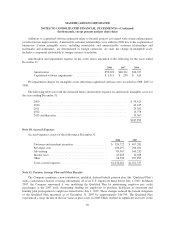
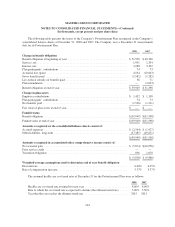
The table below includes a roll-forward of the Company’s ARS investments from January 1, 2008 to
December 31, 2008, and a reclassification of these investments from level 2 to level 3 in the Valuation
Hierarchy. When a determination is made to classify a financial instrument within level 3, the determination is
based upon the significance of the unobservable parameters to the overall fair value measurement. However, the
fair value determination for level 3 financial instruments may include observable components.
Significant
Other
Observable
Inputs
(Level 2)
Significant
Unobservable
Inputs
(Level 3)
Fair value, January 1, 2008 ............................................... $348,000 $ —
Purchases, January 1—March 31, 2008 ...................................... 321,550 —
Sales, January 1—March 31, 2008 ......................................... (420,400) —
Transfers in (out) ....................................................... (249,150) 249,150
Sales, April 1—December 31, 2008 ........................................ — (50)
Calls, July 1—December 31, 2008 ......................................... — (9,400)
Unrealized losses ....................................................... — (47,940)
Fair value, December 31, 2008 ............................................ $ — $191,760
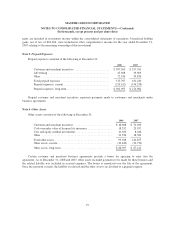
Carrying and Fair Values—Held to Maturity:
The Company also owns certain held-to-maturity investment securities, which primarily consist of three
municipal bonds, one for $154,000 at 7.4% per annum and two totaling $37,434 at approximately 5.0% per
annum. These bonds relate to two of the Company’s U.S. locations; see Note 13 (Debt) and Note 15
(Consolidation of Variable Interest Entity) for additional information. The carrying value, gross unrecorded gains
and fair value of these held-to-maturity investment securities are as follows at December 31:
2008 2007
Carrying value .................................................. $191,450 $192,489
Gross unrecorded gains ........................................... 1,913 9,576
Fair value ...................................................... $193,363 $202,065
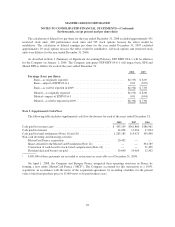
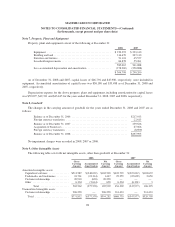
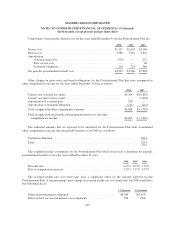
Investment maturities:
The maturity distribution based on the contractual terms of the Company’s investment securities at
December 31, 2008, is as follows:
Available-For-Sale Held-To-Maturity
Amortized
Cost Fair Value
Carrying
Value Fair Value
Due within 1 year ...................................... $ 16,103 $ 16,196 $154,000 $154,566
Due after 1 year through 5 years ........................... 361,050 370,851 37,450 38,797
Due after 5 years through 10 years ......................... 98,990 100,127 — —
Due after 10 years ...................................... 237,302 190,075 — —
No contractual maturity .................................. 102,716 102,606 — —
Total ................................................ $816,161 $779,855 $191,450 $193,363
95