MasterCard 2008 Annual Report Download - page 123
Download and view the complete annual report
Please find page 123 of the 2008 MasterCard annual report below. You can navigate through the pages in the report by either clicking on the pages listed below, or by using the keyword search tool below to find specific information within the annual report.-
 1
1 -
2
-
3
-
4
-
5
-
6
-
7
-
8
-
9
-
10
-
11
-
12
-
13
-
14
-
15
-
16
-
17
-
18
-
19
-
20
-
21
-
22
-
23
-
24
-
25
-
26
-
27
-
28
-
29
-
30
-
31
-
32
-
33
-
34
-
35
-
36
-
37
-
38
-
39
-
40
-
41
-
42
-
43
-
44
-
45
-
46
-
47
-
48
-
49
-
50
-
51
-
52
-
53
-
54
-
55
-
56
-
57
-
58
-
59
-
60
-
61
-
62
-
63
-
64
-
65
-
66
-
67
-
68
-
69
-
70
-
71
-
72
-
73
-
74
-
75
-
76
-
77
-
78
-
79
-
80
-
81
-
82
-
83
-
84
-
85
-
86
-
87
-
88
-
89
-
90
-
91
-
92
-
93
-
94
-
95
-
96
-
97
-
98
-
99
-
100
-
101
-
102
-
103
-
104
-
105
-
106
-
107
-
108
-
109
-
110
-
111
-
112
-
 113
113 -
 114
114 -
 115
115 -
 116
116 -
 117
117 -
 118
118 -
 119
119 -
 120
120 -
 121
121 -
 122
122 -
 123
123 -
 124
124 -
 125
125 -
 126
126 -
 127
127 -
 128
128 -
 129
129 -
 130
130 -
 131
131 -
 132
132 -
 133
133 -
134
-
135
-
136
-
137
-
138
-
139
-
140
-
141
-
142
-
143
-
144
-
145
-
146
-
147
-
148
-
149
-
150
-
151
-
152
-
153
-
154
-
155
-
156
-
157
-
158
-
159
-
160
 |
 |

MASTERCARD INCORPORATED
NOTES TO CONSOLIDATED FINANCIAL STATEMENTS—(Continued)
(In thousands, except percent and per share data)
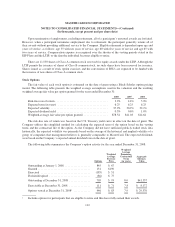
The total intrinsic value of options exercised during the year ended December 31, 2008 and 2007 was
$36,987 and $4,877, respectively. There were no options exercised in the year ended December 31, 2006. As of
December 31, 2008, there was $7,949 of total unrecognized compensation cost related to non-vested options. The
cost is expected to be recognized over a weighted average period of 1.8 years.
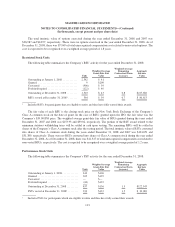
Restricted Stock Units
The following table summarizes the Company’s RSU activity for the year ended December 31, 2008:
Units
Weighted Average
Grant-Date Fair
Value
Weighted Average
Remaining
Contractual Term
(in years)
Aggregate
Intrinsic
Value
Outstanding at January 1, 2008 ........... 2,542 $ 41
Granted ............................. 9 $209
Converted ........................... (906) $ 39
Forfeited/expired ...................... (122) $ 40
Outstanding at December 31, 2008 ........ 1,523 $ 43 0.8 $217,682
RSUs vested at December 31, 20081....... 564 $ 39 0.7 $ 80,613
1Includes RSUs for participants that are eligible to retire and thus have fully earned their awards.
The fair value of each RSU is the closing stock price on the New York Stock Exchange of the Company’s
Class A common stock on the date of grant. In the case of RSUs granted upon the IPO, the fair value was the
Company’s $39.00 IPO price. The weighted average grant-date fair value of RSUs granted during the years ended
December 31, 2007 and 2006 was $153.93 and $39.02, respectively. The portion of the RSU award related to the
minimum statutory withholding taxes will be settled in cash upon vesting. The remaining RSUs will be settled in
shares of the Company’s Class A common stock after the vesting period. The total intrinsic value of RSUs converted
into shares of Class A common stock during the years ended December 31, 2008 and 2007 was $194,051 and
$31,389, respectively. There were no RSUs converted into shares of Class A common stock during the year ended
December 31, 2006. As of December 31, 2008, there was $11,347 of total unrecognized compensation cost related to
non-vested RSUs, respectively. The cost is expected to be recognized over a weighted average period of 1.2 years.
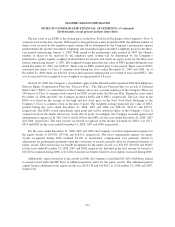
Performance Stock Units
The following table summarizes the Company’s PSU activity for the year ended December 31, 2008:
Units
Weighted Average
Grant-Date Fair
Value
Weighted Average
Remaining
Contractual Term
(in years)
Aggregate
Intrinsic
Value
Outstanding at January 1, 2008 ............ 614 $106
Granted .............................. 305 $192
Converted ............................ — $—
Forfeited/expired ....................... (62) $122
Outstanding at December 31, 2008 ......... 857 $136 1.5 $122,543
PSUs vested at December 31, 20081........ 224 $132 1.5 $ 32,083
1Includes PSUs for participants which are eligible to retire and thus have fully earned their awards.
113