MasterCard 2008 Annual Report Download - page 106
Download and view the complete annual report
Please find page 106 of the 2008 MasterCard annual report below. You can navigate through the pages in the report by either clicking on the pages listed below, or by using the keyword search tool below to find specific information within the annual report.-
 1
1 -
2
-
3
-
4
-
5
-
6
-
7
-
8
-
9
-
10
-
11
-
12
-
13
-
14
-
15
-
16
-
17
-
18
-
19
-
20
-
21
-
22
-
23
-
24
-
25
-
26
-
27
-
28
-
29
-
30
-
31
-
32
-
33
-
34
-
35
-
36
-
37
-
38
-
39
-
40
-
41
-
42
-
43
-
44
-
45
-
46
-
47
-
48
-
49
-
50
-
51
-
52
-
53
-
54
-
55
-
56
-
57
-
58
-
59
-
60
-
61
-
62
-
63
-
64
-
65
-
66
-
67
-
68
-
69
-
70
-
71
-
72
-
73
-
74
-
75
-
76
-
77
-
78
-
79
-
80
-
81
-
82
-
83
-
84
-
85
-
86
-
87
-
88
-
89
-
90
-
91
-
92
-
93
-
94
-
95
-
 96
96 -
 97
97 -
 98
98 -
 99
99 -
 100
100 -
 101
101 -
 102
102 -
 103
103 -
 104
104 -
 105
105 -
 106
106 -
 107
107 -
 108
108 -
 109
109 -
 110
110 -
 111
111 -
 112
112 -
 113
113 -
 114
114 -
 115
115 -
 116
116 -
117
-
118
-
119
-
120
-
121
-
122
-
123
-
124
-
125
-
126
-
127
-
128
-
129
-
130
-
131
-
132
-
133
-
134
-
135
-
136
-
137
-
138
-
139
-
140
-
141
-
142
-
143
-
144
-
145
-
146
-
147
-
148
-
149
-
150
-
151
-
152
-
153
-
154
-
155
-
156
-
157
-
158
-
159
-
160
 |
 |

MASTERCARD INCORPORATED
NOTES TO CONSOLIDATED FINANCIAL STATEMENTS—(Continued)
(In thousands, except percent and per share data)
The majority of securities due after ten years are ARS. Taxable short-term bond funds and foreign equity
securities have been included in the table above in the no contractual maturity category, as these investments do
not have a stated maturity date.
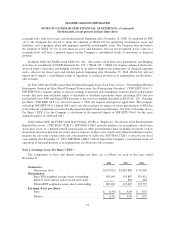
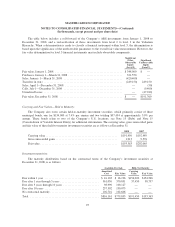
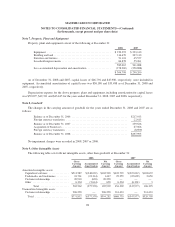
The table below summarizes the maturity ranges of the ARS portfolio, based on relative par value, as of
December 31, 2008:
Par
Amount
%of
Total
Due within 10 years ........................................................... $ 4,000 2%
Due year 11 through year 20 ..................................................... 42,100 17%
Due year 21 through year 30 ..................................................... 141,450 59%
Due after year 30 .............................................................. 52,150 22%
Total ....................................................................... $239,700 100%
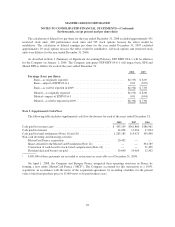
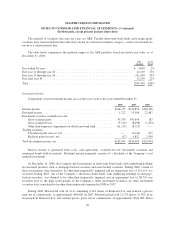
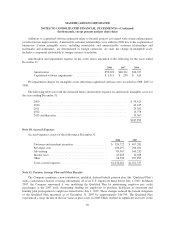
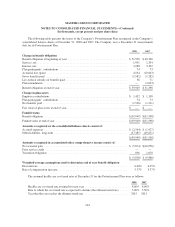
Investment Income
Components of net investment income are as follows for each of the years ended December 31:
2008 2007 2006
Interest income .................................................. $108,757 $140,851 $100,106
Dividend income ................................................ 1,222 15,386 22,867
Investment securities available-for-sale:
Gross realized gains .......................................... 87,579 391,444 187
Gross realized losses ......................................... (3,519) (8,298) (1,233)
Other than temporary impairment on short-term bond fund ........... (11,115) (8,719) —
Trading securities:
Unrealized gains (losses), net ................................... — (2,116) 477
Realized gains (losses), net .................................... (17) 1,852 2,590
Total investment income, net ....................................... $182,907 $530,400 $124,994
Interest income is generated from cash, cash equivalents, available-for-sale investment securities and
municipal bonds held-to-maturity. Dividend income primarily consists of a dividend of the Company’s cost
method investments.
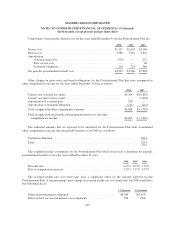
At December 31, 2008, the Company held investments in short-term bond funds, with underlying holdings
in structured products such as mortgage-backed securities and asset-backed securities. During 2008, certain of
these investments were deemed to be other-than-temporarily impaired and an impairment loss of $11,115 was
recorded. During 2007, one of the Company’s short-term bond funds, with underlying holdings in mortgage-
backed securities, was deemed to be other-than-temporarily impaired and an impairment loss of $8,719 was
recorded. Due to the high credit quality of the Company’s other investment securities, no other investment
securities were considered to be other-than-temporarily impaired in 2008 or 2007.
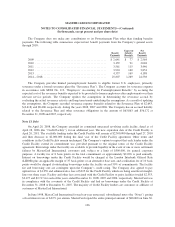
During 2008, MasterCard sold all of its remaining 6,141 shares of Redecard S.A. and realized a pre-tax
gain, net of commissions, of approximately $86,000. In 2007, MasterCard had sold 21,274 shares, or 78% of its
investment in Redecard S.A. and realized pre-tax gains, net of commissions, of approximately $391,000. These
96