MasterCard 2008 Annual Report Download - page 19
Download and view the complete annual report
Please find page 19 of the 2008 MasterCard annual report below. You can navigate through the pages in the report by either clicking on the pages listed below, or by using the keyword search tool below to find specific information within the annual report.-
 1
1 -
2
-
3
-
4
-
5
-
6
-
7
-
8
-
 9
9 -
 10
10 -
 11
11 -
 12
12 -
 13
13 -
 14
14 -
 15
15 -
 16
16 -
 17
17 -
 18
18 -
 19
19 -
 20
20 -
 21
21 -
 22
22 -
 23
23 -
 24
24 -
 25
25 -
 26
26 -
 27
27 -
 28
28 -
 29
29 -
30
-
31
-
32
-
33
-
34
-
35
-
36
-
37
-
38
-
39
-
40
-
41
-
42
-
43
-
44
-
45
-
46
-
47
-
48
-
49
-
50
-
51
-
52
-
53
-
54
-
55
-
56
-
57
-
58
-
59
-
60
-
61
-
62
-
63
-
64
-
65
-
66
-
67
-
68
-
69
-
70
-
71
-
72
-
73
-
74
-
75
-
76
-
77
-
78
-
79
-
80
-
81
-
82
-
83
-
84
-
85
-
86
-
87
-
88
-
89
-
90
-
91
-
92
-
93
-
94
-
95
-
96
-
97
-
98
-
99
-
100
-
101
-
102
-
103
-
104
-
105
-
106
-
107
-
108
-
109
-
110
-
111
-
112
-
113
-
114
-
115
-
116
-
117
-
118
-
119
-
120
-
121
-
122
-
123
-
124
-
125
-
126
-
127
-
128
-
129
-
130
-
131
-
132
-
133
-
134
-
135
-
136
-
137
-
138
-
139
-
140
-
141
-
142
-
143
-
144
-
145
-
146
-
147
-
148
-
149
-
150
-
151
-
152
-
153
-
154
-
155
-
156
-
157
-
158
-
159
-
160
 |
 |

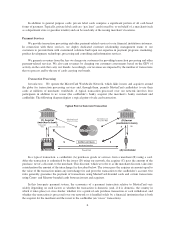
Operations and Business Continuity. Our transaction processing services are managed principally through
our Global Technology and Operations headquarters in O’Fallon, Missouri. Our headquarters is a state-of-the-art
worldwide network control facility with over 50,000 square feet of white computer room environment. Our core
processing network has the capacity to handle 140 million transactions per hour with an average response time of
140 milliseconds. We typically operate at about 80% capacity, and we can substantially scale capacity to meet
demand. The O’Fallon facility also houses the MasterCard Data Warehouse. MasterCard processes transactions
for approximately 24,000 financial institutions in more than 160 currencies from approximately 210 countries
and territories.
Our transaction processing services are available 24 hours per day, every day of the year. Our processing
systems are built with redundancy and automatic back-up procedures to ensure continued operation in the event
of a service interruption. We have consistently maintained availability of our core global processing systems in
excess of 99.9%. Should our O’ Fallon facility be disabled, our co-processing facility in Kansas City, Missouri
would continue operations.
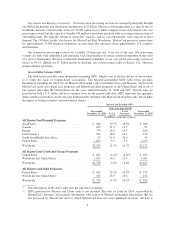
Gross Dollar Volume (GDV)
The table below provides some information regarding GDV, which is one of the key drivers of our revenue,
as it forms the basis of volume-based assessments. The MasterCard-branded GDV table below provides
information regarding the GDV for all MasterCard-branded cards (excluding Cirrus and Maestro) and for both
MasterCard credit and charge card programs and MasterCard debit programs in the United States and in all of
our regions other than the United States for the years ended December 31, 2008 and 2007. Growth rates are
provided on both a U.S. dollar and local currency basis for the periods indicated. GDV represents the aggregate
dollar amount of purchases made and cash disbursements obtained with MasterCard-branded cards and includes
the impact of balance transfers and convenience checks.
MasterCard Branded GDV1
Year-over-year growth
Year ended
December 31, 2008 U.S. $
Local
Currency2
Year ended
December 31, 2007
(In billions, except percentages)
All MasterCard Branded Programs
Asia/Pacific ................................. $ 366 19.7% 18.5% $ 306
Canada ..................................... 102 11.5 11.7 91
Europe ..................................... 774 18.0 15.5 656
Latin America ............................... 184 16.6 16.1 158
South Asia/Middle East Africa .................. 53 24.4 32.6 43
United States ................................ 1,054 3.5 3.5 1,019
Worldwide .................................. $2,533 11.5% 10.7% $2,272
All MasterCard Credit and Charge Programs
United States ................................ $ 631 (2.2)% (2.2)% $ 645
Worldwide less United States ................... 1,167 16.5 15.5 1,001
Worldwide .................................. $1,798 9.2% 8.6% $1,647
All MasterCard Debit Programs
United States ................................ $ 422 13.2% 13.2% $ 373
Worldwide less United States ................... 313 23.9 20.6 252
Worldwide .................................. $ 735 17.5% 16.2% $ 626
* Note that figures in the above table may not sum due to rounding.
(1) GDV generated by Maestro and Cirrus cards is not included. The data set forth for GDV is provided by
MasterCard customers and includes information with respect to MasterCard-branded transactions that are
not processed by MasterCard and for which MasterCard does not earn significant revenues. All data is
9