Konica Minolta 2015 Annual Report Download - page 99
Download and view the complete annual report
Please find page 99 of the 2015 Konica Minolta annual report below. You can navigate through the pages in the report by either clicking on the pages listed below, or by using the keyword search tool below to find specific information within the annual report.-
 1
1 -
2
-
3
-
4
-
5
-
6
-
7
-
8
-
9
-
10
-
11
-
12
-
13
-
14
-
15
-
16
-
17
-
18
-
19
-
20
-
21
-
22
-
23
-
24
-
25
-
26
-
27
-
28
-
29
-
30
-
31
-
32
-
33
-
34
-
35
-
36
-
37
-
38
-
39
-
40
-
41
-
42
-
43
-
44
-
45
-
46
-
47
-
48
-
49
-
50
-
51
-
52
-
53
-
54
-
55
-
56
-
57
-
58
-
59
-
60
-
61
-
62
-
63
-
64
-
65
-
66
-
67
-
68
-
69
-
70
-
71
-
72
-
73
-
74
-
75
-
76
-
77
-
78
-
79
-
80
-
81
-
82
-
83
-
84
-
85
-
86
-
87
-
88
-
 89
89 -
 90
90 -
 91
91 -
 92
92 -
 93
93 -
 94
94 -
 95
95 -
 96
96 -
 97
97 -
 98
98 -
 99
99 -
 100
100 -
 101
101 -
 102
102 -
 103
103 -
 104
104 -
 105
105 -
 106
106 -
 107
107 -
 108
108 -
 109
109 -
110
-
111
-
112
-
113
-
114
-
115
-
116
-
117
-
118
-
119
-
120
-
121
-
122
-
123
-
124
-
125
-
126
-
127
-
128
-
129
-
130
-
131
-
132
-
133
-
134
-
135
-
136
-
137
-
138
-
139
-
140
-
141
-
142
-
143
-
144
 |
 |
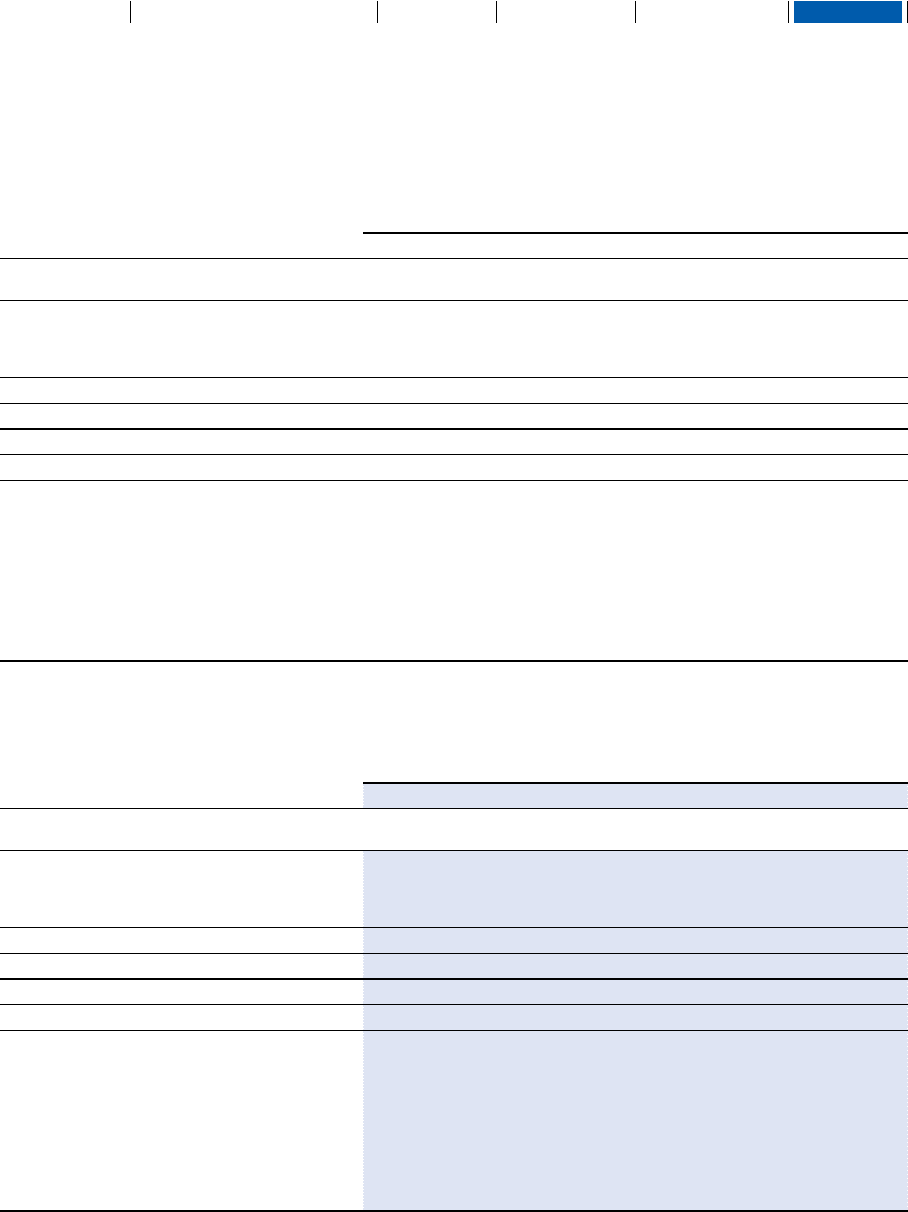
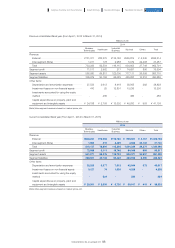
Millions of yen
2014
Business
Technologies Healthcare Industrial
Business Subtotal Others Total
Revenue
External ··········································································································································· ¥731,371 ¥82,375 ¥116,126 ¥929,874 ¥ 5,340 ¥935,214
Inter-segment (Note) ································································································ 1,911 178 2,988 5,079 22,408 27,487
Total ······················································································································································ 733,283 82,554 119,115 934,953 27,748 962,701
Segment profit ····························································································································· 71,517 2,962 217 74,697 806 75,504
Segment assets ························································································································ 585,260 69,851 122,000 777,111 26,598 803,710
Segment liabilities ·················································································································· 305,079 50,158 65,029 420,267 10,312 430,580
Other items
Depreciation and amortization expenses ····························· 27,533 2,613 8,418 38,565 262 38,828
Impairment losses on non-financial assets ······················· 410 25 12,801 13,236 - 13,236
Investments accounted for using the equity
method ············································································································································ - 486 - 486 - 486
Capital expenditures on property, plant and
equipment and intangible assets ······················································· ¥ 24,188 ¥ 2,708 ¥ 13,302 ¥ 40,200 ¥ 903 ¥ 41,103
Previous consolidated fiscal year (From April 1, 2013 to March 31, 2014)
(Note) Inter-segment revenue is based on market prices, etc.
Millions of yen
2015
Business
Technologies Healthcare Industrial
Business Subtotal Others Total
Revenue
External ··········································································································································· ¥808,241 ¥78,568 ¥112,780 ¥ 999,591 ¥ 3,167 ¥1,002,758
Inter-segment (Note) ································································································ 1,895 316 2,425 4,636 23,103 27,740
Total ······················································································································································ 810,137 78,884 115,206 1,004,228 26,270 1,030,498
Segment profit ····························································································································· 72,688 2,111 19,748 94,548 969 95,517
Segment assets ························································································································ 641,271 65,376 119,723 826,371 24,937 851,309
Segment liabilities ·················································································································· 326,801 43,708 53,422 423,932 8,390 432,323
Other items
Depreciation and amortization expenses ····························· 32,253 3,377 7,013 42,644 373 43,017
Impairment losses on non-financial assets ······················· 3,127 74 1,026 4,228 - 4,228
Investments accounted for using the equity
method ············································································································································ - 524 - 524 - 524
Capital expenditures on property, plant and
equipment and intangible assets ······················································· ¥ 29,591 ¥ 2,605 ¥ 6,720 ¥ 38,917 ¥ 415 ¥ 39,333
Current consolidated fiscal year (From April 1, 2014 to March 31, 2015)
(Note) Inter-segment revenue is based on market prices, etc.
98
KONICA MINOLTA, INC. Annual Report 2015
Foundation for GrowthBusiness StrategiesGrowth StrategyCompany Overview and Characteristics Financial Report