Konica Minolta 2015 Annual Report Download - page 76
Download and view the complete annual report
Please find page 76 of the 2015 Konica Minolta annual report below. You can navigate through the pages in the report by either clicking on the pages listed below, or by using the keyword search tool below to find specific information within the annual report.-
 1
1 -
2
-
3
-
4
-
5
-
6
-
7
-
8
-
9
-
10
-
11
-
12
-
13
-
14
-
15
-
16
-
17
-
18
-
19
-
20
-
21
-
22
-
23
-
24
-
25
-
26
-
27
-
28
-
29
-
30
-
31
-
32
-
33
-
34
-
35
-
36
-
37
-
38
-
39
-
40
-
41
-
42
-
43
-
44
-
45
-
46
-
47
-
48
-
49
-
50
-
51
-
52
-
53
-
54
-
55
-
56
-
57
-
58
-
59
-
60
-
61
-
62
-
63
-
64
-
65
-
 66
66 -
 67
67 -
 68
68 -
 69
69 -
 70
70 -
 71
71 -
 72
72 -
 73
73 -
 74
74 -
 75
75 -
 76
76 -
 77
77 -
 78
78 -
 79
79 -
 80
80 -
 81
81 -
 82
82 -
 83
83 -
 84
84 -
 85
85 -
 86
86 -
87
-
88
-
89
-
90
-
91
-
92
-
93
-
94
-
95
-
96
-
97
-
98
-
99
-
100
-
101
-
102
-
103
-
104
-
105
-
106
-
107
-
108
-
109
-
110
-
111
-
112
-
113
-
114
-
115
-
116
-
117
-
118
-
119
-
120
-
121
-
122
-
123
-
124
-
125
-
126
-
127
-
128
-
129
-
130
-
131
-
132
-
133
-
134
-
135
-
136
-
137
-
138
-
139
-
140
-
141
-
142
-
143
-
144
 |
 |
Management’s Discussion and Analysis
Operating Environment
Looking back at the world economy in fiscal year ended March 31,
2015, strong individual spending in the U.S. supported by robust
jobs numbers and a bullish stock market drove global growth.
Uncertainty remained in Europe amid ongoing fears concerning
Greece's financial problems and the problem involving Ukraine.
China saw its economic growth rate cool, and the speed of growth
slackened in emerging countries in Asia and Latin America. The
Japanese economy waxed and waned throughout the year, with
export-related industries enjoying improved business performance
as a result of a rising dollar-yen exchange rate while the domestic
economy felt the repercussions of a last-minute surge in demand
prior to a consumption tax hike in April 2014.
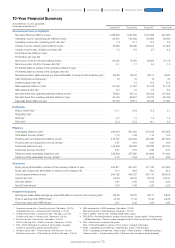
• Profit attributable to owners of the company
Net profit attributable to owners of the company stood at ¥40.9
billion, a 44.4% year-on-year increase. Tax expenses for the fiscal
year climbed to ¥7.9 billion as a result of a reversal of deferred tax
assets in connection with taxation system amendments.
Basic earnings per share were ¥81.01, a more than 50%
increase over the last period.
Return on equity* for the period significantly improved from
last fiscal year’s 6.1% to 8.7%. This was due to balance sheet
improvements from such factors as acquisition of treasury stock
and an increase in net profit attributable to owners of the company.
• Income before tax and minority interests
Financial revenue climbed ¥0.4 billion year on year to ¥2.5 billion,
financial expenses decreased ¥0.2 billion to ¥2.8 billion, and the
financial account balance improved by ¥0.6 billion. The Group
posted a ¥1.1 billion loss on equity method investments attributed
in part to a loss posted last period in connection with the
liquidation of an affiliate company. As a result, profit before tax rose
73.5% year on year to ¥65.4 billion.
• Gross profit
Gross profit for the period rose 10.1% year on year to ¥489.6
billion as a result of exchange-rate gains from a weaker yen, as
well as a gross profit increase in the Business Technologies
Business and cost-cutting measures throughout the organization.
The gross profit margin increased 1.3 points year on year to
48.8%.
• Operating profit
Other income stood at ¥6.8 billion, a ¥1.9 billion year-on-year
increase owing to the sale of fixed assets as an effort to further slim
down the balance sheet. Selling, general and administrative
expenses increased ¥39.1 billion year on year to ¥411.1 billion due
in part to a weaker yen, M&A strategy implementation, and an
increase in upfront investment towards a transformation of our
business portfolio. Other expenses fell to ¥19.5 billion, a ¥18.2
billion decrease year on year owing significantly to a total loss of
¥16.1 billion comprising an impairment loss and loss on withdrawal
from the glass substrates for HDDs business posted last period.
As a result, operating profit for the period was up 65.0% year on
year to ¥65.7 billion, while the operating profit ratio rose to 6.6%, a
2.3 point increase year on year.
• Revenue
Average Japanese yen rates against the U.S. dollar and euro for
the period were ¥109.93 and ¥138.77, respectively, constituting a
¥9.69 (9.7%) decrease against the dollar and a ¥4.40 (3.3%)
decrease against the euro compared to last period. Revenue for
the fiscal year under review increased 7.2% year on year to
¥1,002.7 billion, primarily driven by exchange-rate gains from a
weaker yen and by the Business Technologies Business, which
increased sales more than 10% over last period. The strong sales
figures for the Business Technologies Business were supported by
M&A activities, as well as original Konica Minolta sales strategies
that leveraged the Company’s considerable direct marketing
acumen and ability to offer suitable solutions to customers.
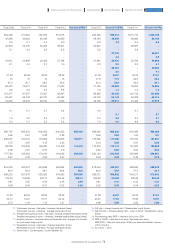
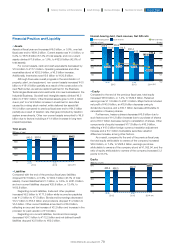
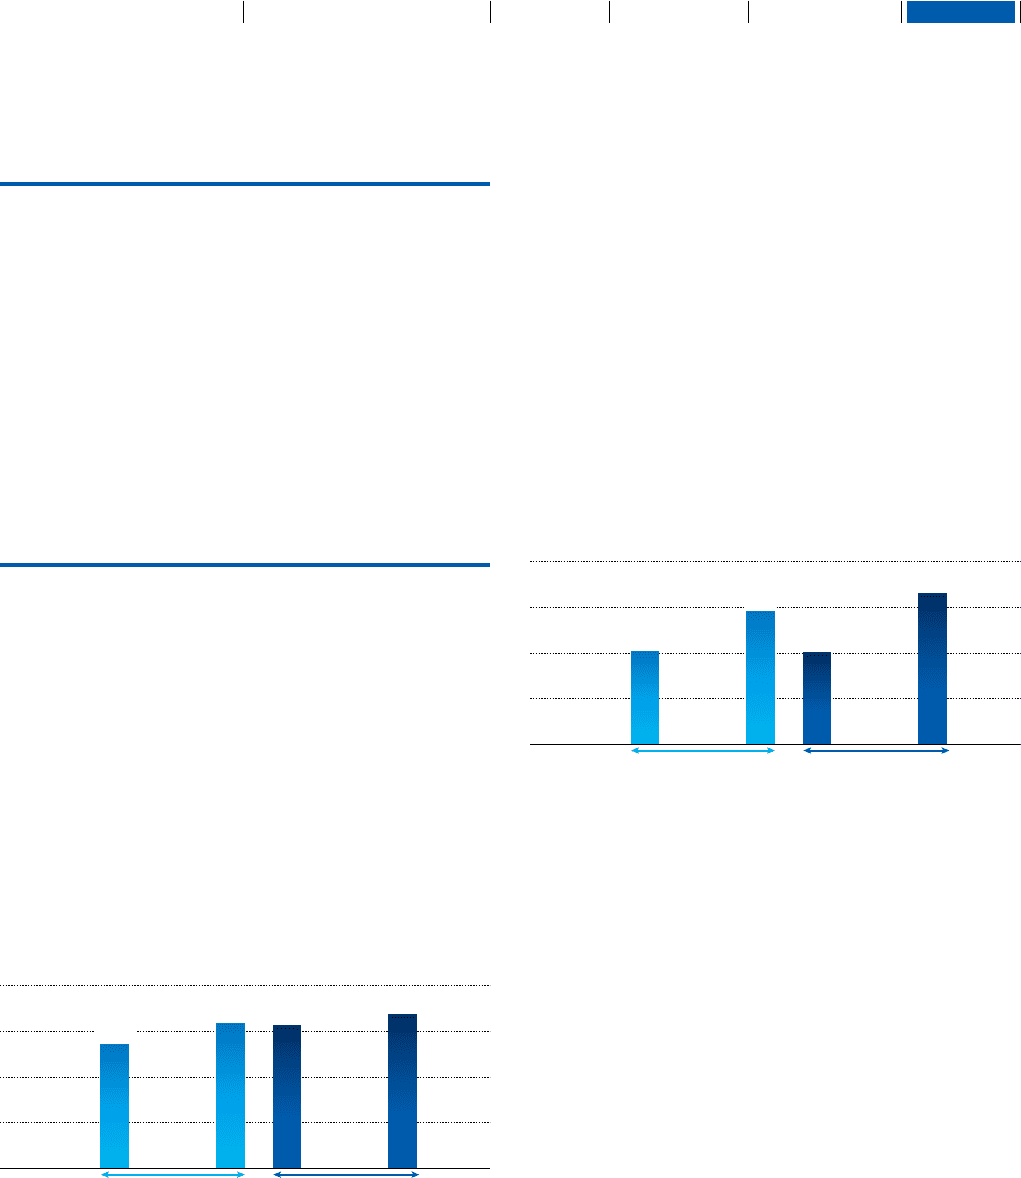
Operating Results
Revenue
Operating profit
1,200
900
600
300
0
(Billions of yen)
20132012 2014
(FY)
935.2 1,002.7
J-GAAP IFRS
943.7
813.0
80
60
40
20
0
(Billions of yen)
40.6 39.8
65.7
20132012 2014
(FY)
J-GAAP IFRS
58.1
75
KONICA MINOLTA, INC. Annual Report 2015
Foundation for GrowthBusiness StrategiesGrowth StrategyCompany Overview and Characteristics Financial Report