Konica Minolta 2015 Annual Report Download - page 105
Download and view the complete annual report
Please find page 105 of the 2015 Konica Minolta annual report below. You can navigate through the pages in the report by either clicking on the pages listed below, or by using the keyword search tool below to find specific information within the annual report.-
 1
1 -
2
-
3
-
4
-
5
-
6
-
7
-
8
-
9
-
10
-
11
-
12
-
13
-
14
-
15
-
16
-
17
-
18
-
19
-
20
-
21
-
22
-
23
-
24
-
25
-
26
-
27
-
28
-
29
-
30
-
31
-
32
-
33
-
34
-
35
-
36
-
37
-
38
-
39
-
40
-
41
-
42
-
43
-
44
-
45
-
46
-
47
-
48
-
49
-
50
-
51
-
52
-
53
-
54
-
55
-
56
-
57
-
58
-
59
-
60
-
61
-
62
-
63
-
64
-
65
-
66
-
67
-
68
-
69
-
70
-
71
-
72
-
73
-
74
-
75
-
76
-
77
-
78
-
79
-
80
-
81
-
82
-
83
-
84
-
85
-
86
-
87
-
88
-
89
-
90
-
91
-
92
-
93
-
94
-
 95
95 -
 96
96 -
 97
97 -
 98
98 -
 99
99 -
 100
100 -
 101
101 -
 102
102 -
 103
103 -
 104
104 -
 105
105 -
 106
106 -
 107
107 -
 108
108 -
 109
109 -
 110
110 -
 111
111 -
 112
112 -
 113
113 -
 114
114 -
 115
115 -
116
-
117
-
118
-
119
-
120
-
121
-
122
-
123
-
124
-
125
-
126
-
127
-
128
-
129
-
130
-
131
-
132
-
133
-
134
-
135
-
136
-
137
-
138
-
139
-
140
-
141
-
142
-
143
-
144
 |
 |

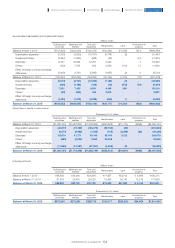
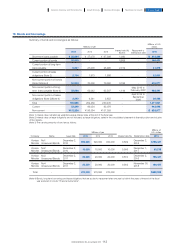
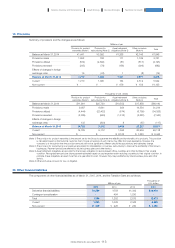
(Accumulated depreciation and impairment losses)
Millions of yen
Buildings and
structures
Machinery and
vehicles
Tools and
equipment Rental assets Land Construction in
progress Total
Balance at April 1, 2013 ············································· (¥112,400) (¥222,040) (¥123,374) (¥30,243) (¥1,290) (¥51) (¥489,399)
Depreciation expenses ·········································· (5,708) (9,830) (10,181) (5,774) (2) - (31,497)
Impairment losses ·························································· (9,397) (7,293) (648) (25) - (37) (17,401)
Disposals ······················································································· 6,337 30,964 12,291 4,225 - 3 53,822
Others ································································································· (129) 7,674 502 3,628 (119) 13 11,569
Effect of foreign currency exchange
differences ················································································· (2,008) (1,701) (2,845) (1,953) (2) 0 (8,512)
Balance at March 31, 2014 ·································· (123,307) (202,226) (124,255) (30,142) (1,415) (72) (481,418)
Depreciation expenses ·········································· (5,513) (8,747) (12,423) (7,180) (3) - (33,868)
Impairment loss ·································································· (826) (1,188) (128) (15) (275) (10) (2,444)
Disposals ······················································································· 7,531 7,423 9,631 4,346 386 - 29,319
Others ································································································· (82) (244) 344 2,819 - - 2,837
Effect of foreign currency exchange
differences ················································································· (1,425) (1,572) (3,288) (545) 3 - (6,828)
Balance at March 31, 2015 ··························· (¥123,623) (¥206,554) (¥130,120) (¥30,717) (¥1,304) (¥82) (¥492,402)
Thousands of U.S. dollars
Buildings and
structures
Machinery and
vehicles
Tools and
equipment Rental assets Land Construction in
progress Total
Balance at March 31, 2014 ·································· ($1,026,105) ($1,682,833) ($1,033,994) ($250,828) ($11,775) ($599) ($4,006,141)
Depreciation expenses ·········································· (45,877) (72,789) (103,379) (59,749) (25) - (281,834)
Impairment loss ·································································· (6,874) (9,886) (1,065) (125) (2,288) (83) (20,338)
Disposals ······················································································· 62,670 61,771 80,145 36,165 3,212 - 243,979
Others ································································································· (682) (2,030) 2,863 23,458 - - 23,608
Effect of foreign currency exchange
differences ················································································· (11,858) (13,081) (27,361) (4,535) 25 - (56,820)
Balance at March 31, 2015 ··························· ($1,028,734) ($1,718,848) ($1,082,799) ($255,613) ($10,851) ($682) ($4,097,545)
(Note) Others is transfer to other account.
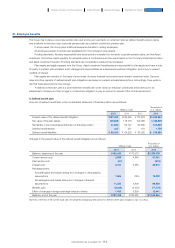
(Carrying amount)
Millions of yen
Buildings and
structures
Machinery and
vehicles
Tools and
equipment Rental assets Land Construction in
progress Total
Balance at April 1, 2013 ············································· ¥68,650 ¥34,264 ¥24,956 ¥11,457 ¥34,013 ¥ 6,969 ¥180,311
Balance at March 31, 2014 ·································· 61,816 25,418 29,023 12,668 34,310 13,819 177,056
Balance at March 31, 2015 ··························· ¥68,805 ¥32,720 ¥30,729 ¥13,240 ¥31,992 ¥ 4,153 ¥181,641
Thousands of U.S. dollars
Buildings and
structures
Machinery and
vehicles
Tools and
equipment Rental assets Land Construction in
progress Total
Balance at March 31, 2015 ··························· $572,564 $272,281 $255,713 $110,177 $266,223 $34,559 $1,511,534
104
KONICA MINOLTA, INC. Annual Report 2015
Foundation for GrowthBusiness StrategiesGrowth StrategyCompany Overview and Characteristics Financial Report