Konica Minolta 2015 Annual Report Download - page 101
Download and view the complete annual report
Please find page 101 of the 2015 Konica Minolta annual report below. You can navigate through the pages in the report by either clicking on the pages listed below, or by using the keyword search tool below to find specific information within the annual report.-
 1
1 -
2
-
3
-
4
-
5
-
6
-
7
-
8
-
9
-
10
-
11
-
12
-
13
-
14
-
15
-
16
-
17
-
18
-
19
-
20
-
21
-
22
-
23
-
24
-
25
-
26
-
27
-
28
-
29
-
30
-
31
-
32
-
33
-
34
-
35
-
36
-
37
-
38
-
39
-
40
-
41
-
42
-
43
-
44
-
45
-
46
-
47
-
48
-
49
-
50
-
51
-
52
-
53
-
54
-
55
-
56
-
57
-
58
-
59
-
60
-
61
-
62
-
63
-
64
-
65
-
66
-
67
-
68
-
69
-
70
-
71
-
72
-
73
-
74
-
75
-
76
-
77
-
78
-
79
-
80
-
81
-
82
-
83
-
84
-
85
-
86
-
87
-
88
-
89
-
90
-
 91
91 -
 92
92 -
 93
93 -
 94
94 -
 95
95 -
 96
96 -
 97
97 -
 98
98 -
 99
99 -
 100
100 -
 101
101 -
 102
102 -
 103
103 -
 104
104 -
 105
105 -
 106
106 -
 107
107 -
 108
108 -
 109
109 -
 110
110 -
 111
111 -
112
-
113
-
114
-
115
-
116
-
117
-
118
-
119
-
120
-
121
-
122
-
123
-
124
-
125
-
126
-
127
-
128
-
129
-
130
-
131
-
132
-
133
-
134
-
135
-
136
-
137
-
138
-
139
-
140
-
141
-
142
-
143
-
144
 |
 |

Millions of yen
Thousands of
U.S. dollars
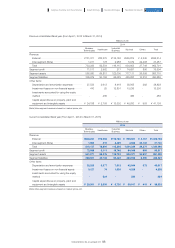
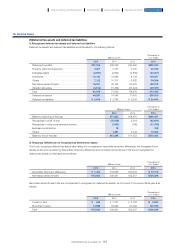
Liabilities 2015 2014 2013 2015
Total liabilities of reportable segments ···················································· ¥423,932 ¥420,267 ¥386,724 $3,527,769
Liabilities categorized in “Others” ·································································· 8,390 10,312 21,551 69,818
Total of reportable and Others segments ·········································· 432,323 430,580 408,276 3,597,595
Adjustments (Note) ··················································································································· 32,429 61,837 83,585 269,859
Liabilities reported in consolidated statement of
financial position ···························································································································· ¥464,752 ¥492,417 ¥491,862 $3,867,454
Millions of yen
Total of reportable
segments Others Adjustments (Note) Reported in consolidated
financial statements
Other items 2015 2014 2015 2014 2015 2014 2015 2014
Depreciation and amortization
expenses ····································································· ¥42,644 ¥38,565 ¥373 ¥262 ¥4,887 ¥4,999 ¥47,905 ¥43,827
Impairment losses on non-
financial assets ················································· 4,228 13,236 -- 957 4,250 5,185 17,487
Investments accounted for
using the equity method ·················· 524 486 ---- 524 486
Capital expenditures on
property, plant and equipment
and intangible assets ····························· ¥38,917 ¥40,200 ¥415 ¥903 ¥6,766 ¥6,280 ¥46,100 ¥47,383
(Note) Adjustments include eliminations for inter-segment transactions and corporate liabilities, which are mainly interest-bearing debts (bonds and
borrowings, etc.) not attributed to any reportable segment.
(Note) Adjustments for depreciation and amortization expenses and impairment losses are mainly for buildings that are not attributed to any reportable
segment.
In relation to other items, adjustments to capital expenditures are mainly for capital expenditures for buildings that are not attributed to any
reportable segment.
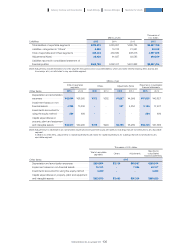
Thousands of U.S. dollars
Total of reportable
segments Others Adjustments
Reported in
consolidated
financial statements
Other items 2015
Depreciation and amortization expenses ···················································· $354,864 $3,104 $40,667 $398,644
Impairment losses on non-financial assets ·············································· 35,183 - 7,964 43,147
Investments accounted for using the equity method ············· 4,360 - - 4,360
Capital expenditures on property, plant and equipment
and intangible assets ····················································································································· $323,850 $3,453 $56,304 $383,623
100
KONICA MINOLTA, INC. Annual Report 2015
Foundation for GrowthBusiness StrategiesGrowth StrategyCompany Overview and Characteristics Financial Report