Konica Minolta 2015 Annual Report Download - page 117
Download and view the complete annual report
Please find page 117 of the 2015 Konica Minolta annual report below. You can navigate through the pages in the report by either clicking on the pages listed below, or by using the keyword search tool below to find specific information within the annual report.-
 1
1 -
2
-
3
-
4
-
5
-
6
-
7
-
8
-
9
-
10
-
11
-
12
-
13
-
14
-
15
-
16
-
17
-
18
-
19
-
20
-
21
-
22
-
23
-
24
-
25
-
26
-
27
-
28
-
29
-
30
-
31
-
32
-
33
-
34
-
35
-
36
-
37
-
38
-
39
-
40
-
41
-
42
-
43
-
44
-
45
-
46
-
47
-
48
-
49
-
50
-
51
-
52
-
53
-
54
-
55
-
56
-
57
-
58
-
59
-
60
-
61
-
62
-
63
-
64
-
65
-
66
-
67
-
68
-
69
-
70
-
71
-
72
-
73
-
74
-
75
-
76
-
77
-
78
-
79
-
80
-
81
-
82
-
83
-
84
-
85
-
86
-
87
-
88
-
89
-
90
-
91
-
92
-
93
-
94
-
95
-
96
-
97
-
98
-
99
-
100
-
101
-
102
-
103
-
104
-
105
-
106
-
 107
107 -
 108
108 -
 109
109 -
 110
110 -
 111
111 -
 112
112 -
 113
113 -
 114
114 -
 115
115 -
 116
116 -
 117
117 -
 118
118 -
 119
119 -
 120
120 -
 121
121 -
 122
122 -
 123
123 -
 124
124 -
 125
125 -
 126
126 -
 127
127 -
128
-
129
-
130
-
131
-
132
-
133
-
134
-
135
-
136
-
137
-
138
-
139
-
140
-
141
-
142
-
143
-
144
 |
 |

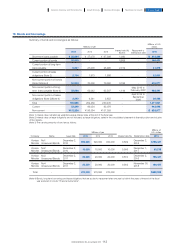
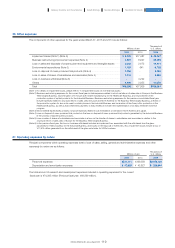
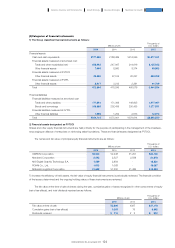
(1)Share capital and Treasury shares
22. Equity and other equity items
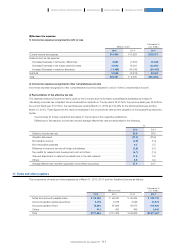
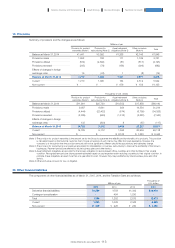
Principal actuarial assumptions used to measure defined benefit obligations are as follows:
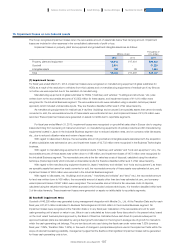
2) Defined contribution plan
The amount recorded as expenses in relation to defined contribution plans are the amounts contributed to these plans during the
year. This amount was ¥4,560 million for the current fiscal year (previous fiscal year: ¥4,102 million).
3) Other employee benefits
Certain U.S. subsidiaries employ a Supplemental Executive Retirement Plan (SERP). Obligations incurred under this plan amounted
to ¥2,362 million for the current fiscal year (previous fiscal year: ¥1,646 million, Transition Date: ¥1,197 million). These amounts are
recognized as other non-current liabilities.
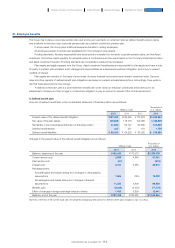
The table below indicates the effect of a 0.5% increase or decrease in major actuarial assumptions, while other variables are kept
constant. In reality, individual assumptions may be simultaneous affected by fluctuations in economic indicators and conditions.
Accordingly, because fluctuations may occur independently or mutually, the actual impact of these fluctuations on defined benefit
plan obligations may differ from these assumptions.
%
2015 2014 2013
Discount rate ······································································································································································································ 0.71 1.00 1.42
Millions of yen Thousands of U.S. dollars
2015 2014 2015
Increase Decrease Increase Decrease Increase Decrease
Effect of change of discount rate ······························ (¥6,522) ¥6,698 (¥6,467) ¥6,897 ($54,273) $55,738
Number of
authorized shares
Number of issued shares
(Note 1) (Note 2)
Number of
treasury shares
At April 1, 2013 ·································································································································· 1,200,000,000 531,664,337 1,346,048
Increase (Note 3) ··························································································································· - - 15,402,953
Decrease ······················································································································································· - - 28,313
At March 31, 2014 ······················································································································· 1,200,000,000 531,664,337 16,720,688
Increase (Note 3) ··························································································································· - - 13,143,715
Decrease (Note 4) ······················································································································· - 20,000,000 20,063,332
At March 31, 2015 ··················································································································· 1,200,000,000 511,664,337 9,801,071
(Note 1) Shares issued by the Company are non-par value ordinary shares.
(Note 2) Issued shares are fully paid.
(Note 3) Based on a Board of Directors resolution on January 30, 2014, and a Board of Directors resolution on July 30, 2014, 15,365,000 treasury
shares were acquired in the previous fiscal year, and 13,135,900 treasury shares were acquired in the current fiscal year.
(Note 4) Based on a Board of Directors resolution on July 30, 2014, 20,000,000 treasury shares were cancelled on August 29, 2014.
116
KONICA MINOLTA, INC. Annual Report 2015
Foundation for GrowthBusiness StrategiesGrowth StrategyCompany Overview and Characteristics Financial Report