Konica Minolta 2015 Annual Report Download - page 121
Download and view the complete annual report
Please find page 121 of the 2015 Konica Minolta annual report below. You can navigate through the pages in the report by either clicking on the pages listed below, or by using the keyword search tool below to find specific information within the annual report.-
 1
1 -
2
-
3
-
4
-
5
-
6
-
7
-
8
-
9
-
10
-
11
-
12
-
13
-
14
-
15
-
16
-
17
-
18
-
19
-
20
-
21
-
22
-
23
-
24
-
25
-
26
-
27
-
28
-
29
-
30
-
31
-
32
-
33
-
34
-
35
-
36
-
37
-
38
-
39
-
40
-
41
-
42
-
43
-
44
-
45
-
46
-
47
-
48
-
49
-
50
-
51
-
52
-
53
-
54
-
55
-
56
-
57
-
58
-
59
-
60
-
61
-
62
-
63
-
64
-
65
-
66
-
67
-
68
-
69
-
70
-
71
-
72
-
73
-
74
-
75
-
76
-
77
-
78
-
79
-
80
-
81
-
82
-
83
-
84
-
85
-
86
-
87
-
88
-
89
-
90
-
91
-
92
-
93
-
94
-
95
-
96
-
97
-
98
-
99
-
100
-
101
-
102
-
103
-
104
-
105
-
106
-
107
-
108
-
109
-
110
-
 111
111 -
 112
112 -
 113
113 -
 114
114 -
 115
115 -
 116
116 -
 117
117 -
 118
118 -
 119
119 -
 120
120 -
 121
121 -
 122
122 -
 123
123 -
 124
124 -
 125
125 -
 126
126 -
 127
127 -
 128
128 -
 129
129 -
 130
130 -
 131
131 -
132
-
133
-
134
-
135
-
136
-
137
-
138
-
139
-
140
-
141
-
142
-
143
-
144
 |
 |
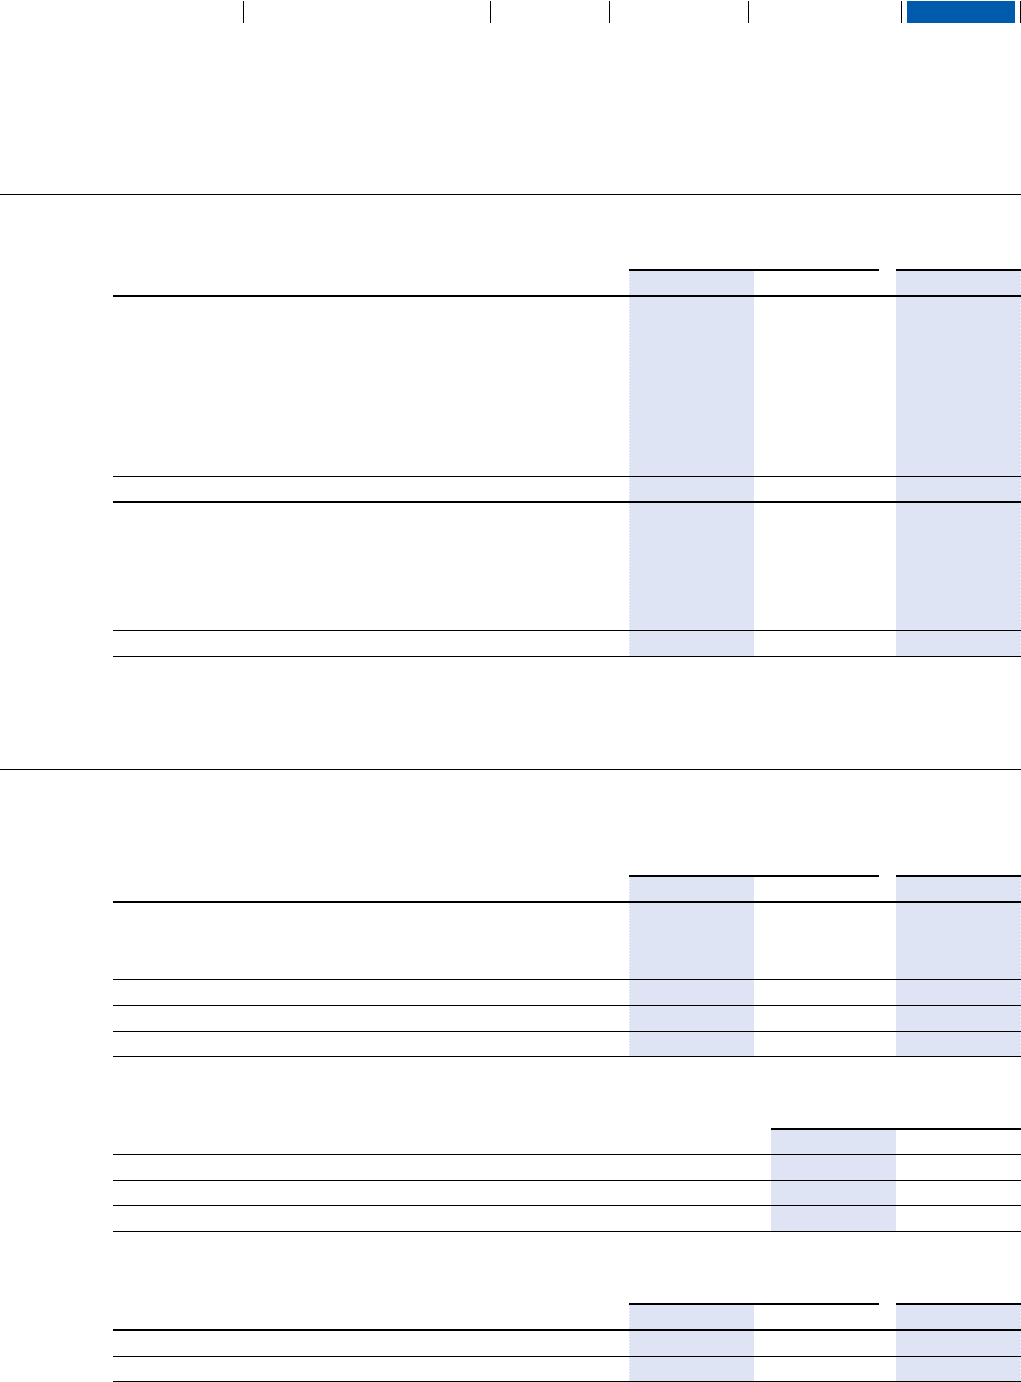
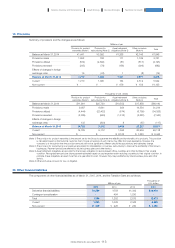
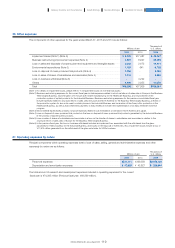
A calculation of basic and diluted earnings per share attributable to owners of the Company for fiscal years ended March 31, 2015
and 2014 is as follows:
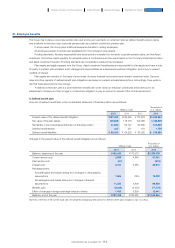
29. Earnings per share
The components of finance income and costs, for fiscal years ended March 31, 2015 and 2014 are as follows:
28. Finance income and costs
Millions of yen
Thousands of
U.S. dollars
2015 2014 2015
Finance income
Interest income (Note 1)
Financial assets measured at amortized cost ·················································································· ¥1,689 ¥1,641 $14,055
Dividends received
Financial assets measured at FVTOCI ·········································································································· 844 480 7,023
Gain on valuation of investment securities
Financial assets measured at FVTPL ·············································································································· 7 3 58
Total ··································································································································································································································· 2,541 2,125 21,145
Finance costs
Interest expense (Note 1)
Financial assets measured at amortized cost ·················································································· 2,276 2,642 18,940
Financial assets measured at FVTPL ·············································································································· 121 209 1,007
Foreign exchange loss (net) (Note 2) ························································································································ 449 232 3,736
Total ··································································································································································································································· ¥2,848 ¥3,084 $23,700
Millions of yen
Thousands of
U.S. dollars
2015 2014 2015
Basis of calculating basic earnings per share
Profit for the year attributable to owners of the Company ·················································· ¥40,934 ¥28,354 $340,634
Profit for the year not attributable to owners of the Company ····································· ---
Profit for the year to calculate basic earnings per share ··············································· 40,934 28,354 340,634
Adjustments of profit for the year ·························································································································· ---
Profit for the year to calculate diluted earnings per share ········································· ¥40,934 ¥28,354 $340,634
Yen U.S. dollars
2015 2014 2015
Basic earnings per share attributable to owners of the Company ································· ¥81.01 ¥53.67 $0.67
Diluted earnings per share attributable to owners of Company ········································· ¥80.79 ¥53.54 $0.67
Thousands of shares
2015 2014
Weighted average number of ordinary shares outstanding during the period ··············································· 505,282 528,269
Increase in the number of ordinary shares under subscription rights to shares ··············································· 1,412 1,281
Weighted average number of diluted ordinary shares outstanding during the period ·············································· 506,695 529,550
(Note 1) Valuation gains or losses on interest rate derivatives are included in interest income or interest expense.
(Note 2) Valuation gains or losses on currency derivatives are included in foreign exchange differences.
120
KONICA MINOLTA, INC. Annual Report 2015
Foundation for GrowthBusiness StrategiesGrowth StrategyCompany Overview and Characteristics Financial Report