Konica Minolta 2015 Annual Report Download - page 127
Download and view the complete annual report
Please find page 127 of the 2015 Konica Minolta annual report below. You can navigate through the pages in the report by either clicking on the pages listed below, or by using the keyword search tool below to find specific information within the annual report.-
 1
1 -
2
-
3
-
4
-
5
-
6
-
7
-
8
-
9
-
10
-
11
-
12
-
13
-
14
-
15
-
16
-
17
-
18
-
19
-
20
-
21
-
22
-
23
-
24
-
25
-
26
-
27
-
28
-
29
-
30
-
31
-
32
-
33
-
34
-
35
-
36
-
37
-
38
-
39
-
40
-
41
-
42
-
43
-
44
-
45
-
46
-
47
-
48
-
49
-
50
-
51
-
52
-
53
-
54
-
55
-
56
-
57
-
58
-
59
-
60
-
61
-
62
-
63
-
64
-
65
-
66
-
67
-
68
-
69
-
70
-
71
-
72
-
73
-
74
-
75
-
76
-
77
-
78
-
79
-
80
-
81
-
82
-
83
-
84
-
85
-
86
-
87
-
88
-
89
-
90
-
91
-
92
-
93
-
94
-
95
-
96
-
97
-
98
-
99
-
100
-
101
-
102
-
103
-
104
-
105
-
106
-
107
-
108
-
109
-
110
-
111
-
112
-
113
-
114
-
115
-
116
-
 117
117 -
 118
118 -
 119
119 -
 120
120 -
 121
121 -
 122
122 -
 123
123 -
 124
124 -
 125
125 -
 126
126 -
 127
127 -
 128
128 -
 129
129 -
 130
130 -
 131
131 -
 132
132 -
 133
133 -
 134
134 -
 135
135 -
 136
136 -
 137
137 -
138
-
139
-
140
-
141
-
142
-
143
-
144
 |
 |

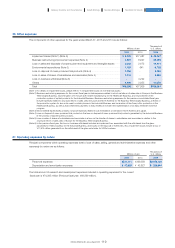
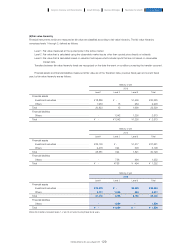
(b) Allowance for doubtful accounts
The Group uses an allowance for doubtful accounts to record impairment losses on individually significant financial assets for
their non-recoverable amounts and on financial assets that are not individually significant for the non-recoverable amounts
estimated based on such factors as past performance of such financial assets.
The allowance for doubtful accounts for these financial assets is included in “trade and other receivables” and “other
financial assets” in the consolidated statement of financial position. Changes in allowances for doubtful accounts for trade
receivables and other financial assets in the respective fiscal years are as follows:
Taking into account such factors as customers’ financial conditions and past-due status, impairment losses recognized on
trade and other receivables were ¥6,000 million, ¥6,218 million and ¥10,002 million at the Transition Date, end of the previous
fiscal year and end of the current fiscal year, respectively. Allowances for doubtful accounts on these receivables were ¥685
million, ¥785 million and ¥1,407 million, respectively.
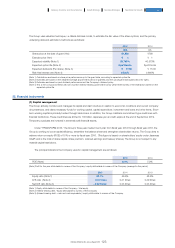
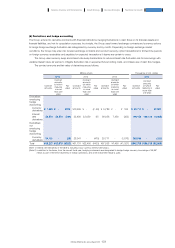
2) Liquidity risk (Risk of not being able to pay on the payment due date)
The Group raises funds through borrowings and other means. With these liabilities, the Group assumes liquidity risk arising from the
possibility that it may become unable to meet its payment obligations on their due date, owing to deterioration in the fund-raising
environment.
To control liquidity risk, the Company’s finance department creates and updates cash plans as necessary, based on
information obtained from its consolidated subsidiaries and various departments. At the same time, the Company constantly
monitors the operating environment to maintain and ensure appropriate on-hand liquidity in response to changing conditions.
Balances of long-term financial liabilities by due date are shown below. Contractual cash flows are undiscounted cash flows
that do not include interest payment amounts.
As of April 1, 2013
Millions of yen
Thousands of
U.S. dollars
2015 2014 2015
Balance, beginning of the year ··········································································································································· ¥6,527 ¥5,934 $54,315
Provisions made ·················································································································································································· 2,210 1,267 18,391
Provisions utilized ·············································································································································································· (1,061) (1,192) (8,829)
Provisions reversed ········································································································································································ (768) (410) (6,391)
Effects of changes in foreign exchange rates ·················································································· 3 928 25
Balance, end of the year ································································································································································ ¥6,911 ¥6,527 $57,510
Millions of yen
Carrying
amounts
Contractual
cash flows
Less than
1 year
More than
1 year, less
than 2 years
More than
2 years, less
than 3 years
More than
3 years, less
than 4 years
More than
4 years, less
than 5 years
More than
5 years
Long-term loans payable ············· ¥ 87,498 ¥ 87,498 ¥23,990 ¥27,004 ¥ 5,000 ¥ 4,000 ¥ 9,000 ¥18,501
Bonds ············································································ 70,000 70,000 - - 20,000 20,000 10,000 20,000
Lease obligations ······································· 5,538 5,538 1,686 1,445 1,543 520 192 149
Others ··········································································· 2,573 2,573 2,342 230 - - - -
Total ·················································································· ¥165,610 ¥165,610 ¥28,020 ¥28,680 ¥26,544 ¥24,520 ¥19,193 ¥38,650
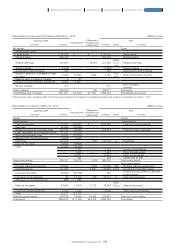
As of March 31, 2014
Millions of yen
Carrying
amounts
Contractual
cash flows
Less than
1 year
More than
1 year, less
than 2 years
More than
2 years, less
than 3 years
More than
3 years, less
than 4 years
More than
4 years, less
than 5 years
More than
5 years
Long-term loans payable ············· ¥ 89,045 ¥ 89,045 ¥27,003 ¥ 5,001 ¥ 4,001 ¥ 9,001 ¥ 3,000 ¥41,038
Bonds ············································································ 70,000 70,000 - 20,000 20,000 10,000 20,000 -
Lease obligations ······································· 6,315 6,315 1,973 2,333 1,123 575 186 122
Others ··········································································· 1,252 1,252 1,026 - - - - 226
Total ·················································································· ¥166,613 ¥166,613 ¥30,003 ¥27,335 ¥25,124 ¥19,576 ¥23,186 ¥41,387
126
KONICA MINOLTA, INC. Annual Report 2015
Foundation for GrowthBusiness StrategiesGrowth StrategyCompany Overview and Characteristics Financial Report