Konica Minolta 2015 Annual Report Download - page 23
Download and view the complete annual report
Please find page 23 of the 2015 Konica Minolta annual report below. You can navigate through the pages in the report by either clicking on the pages listed below, or by using the keyword search tool below to find specific information within the annual report.-
 1
1 -
2
-
3
-
4
-
5
-
6
-
7
-
8
-
9
-
10
-
11
-
12
-
 13
13 -
 14
14 -
 15
15 -
 16
16 -
 17
17 -
 18
18 -
 19
19 -
 20
20 -
 21
21 -
 22
22 -
 23
23 -
 24
24 -
 25
25 -
 26
26 -
 27
27 -
 28
28 -
 29
29 -
 30
30 -
 31
31 -
 32
32 -
 33
33 -
34
-
35
-
36
-
37
-
38
-
39
-
40
-
41
-
42
-
43
-
44
-
45
-
46
-
47
-
48
-
49
-
50
-
51
-
52
-
53
-
54
-
55
-
56
-
57
-
58
-
59
-
60
-
61
-
62
-
63
-
64
-
65
-
66
-
67
-
68
-
69
-
70
-
71
-
72
-
73
-
74
-
75
-
76
-
77
-
78
-
79
-
80
-
81
-
82
-
83
-
84
-
85
-
86
-
87
-
88
-
89
-
90
-
91
-
92
-
93
-
94
-
95
-
96
-
97
-
98
-
99
-
100
-
101
-
102
-
103
-
104
-
105
-
106
-
107
-
108
-
109
-
110
-
111
-
112
-
113
-
114
-
115
-
116
-
117
-
118
-
119
-
120
-
121
-
122
-
123
-
124
-
125
-
126
-
127
-
128
-
129
-
130
-
131
-
132
-
133
-
134
-
135
-
136
-
137
-
138
-
139
-
140
-
141
-
142
-
143
-
144
 |
 |

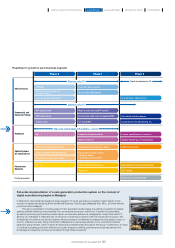
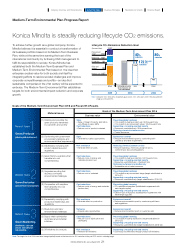
Materiality (Opportunities) Materiality (Risk)
Fiscal 2014 results
Business value Environmental value
Sales
• Sales of Green Products: 547.1 billion yen (Share of sales: 54%)
Cost reductions
• Reduce cost of product materials
Preventing global warming
• CO2 reduction during product use: 43 thousand tons
• CO2 reduction at procurement stage: 76 thousand tons
Supporting a recycling-oriented society
• Resources used effectively: 24 thousand tons
Reducing chemical substance risks
• Control emissions
Cost reductions
• Reduce costs of energy and materials (reduce loss)
Preventing global warming
• CO2 reduction during production: 1.9 thousand tons
Supporting a recycling-oriented society
• Resources used effectively: 2.3 hundred tons
Restoring and preserving biodiversity
• Sustainable use of water resources
Net sales
• Acquire sales opportunities
Environment overall
• Reduce environmental impact at customer side
Sales
• Eliminate lost sales opportunities
Environment overall
• Reduce environmental impact by conforming with standards and label
requirements
Risk avoidance
• Eliminate effect on sales
Reducing chemical substance risks
• Reduce hazardous chemical substance risk by conforming with laws and regulations
Cost reductions
• Reduce costs of energy and materials (reduce loss)
(New material issue from fiscal 2015)
Preventing global warming
• CO2 reductions at suppliers: 1 thousand tons
Supporting a recycling-oriented society
• Resources used effectively: 3 hundred tons
Cost reductions
• Reduce cost of distribution and packaging
Preventing global warming
• CO2 reduction during distribution: 7 hundred tons
Supporting a recycling-oriented society
• Resources used effectively: 2.5 hundred tons
Risk avoidance
• Reinforce 3R initiatives
Supporting a recycling-oriented society
• Use resources effectively through product 3R initiatives
Risk avoidance
• Eliminate effect on production
Environment overall
• Reduce environmental impact by conforming with laws and regulations
Note:
The expressions have been changed for some material issues and issues added, based on the results of a materiality analysis.
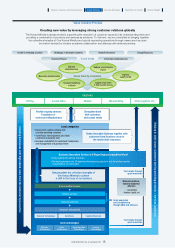
Restoring and
preserving biodiversity
Resolution of environmental issues in communities
Product recycling
Resolution of environmental
issues by employees
Addressing resource depletion
(petroleum resources)
Meeting customers’
environmental requests
Practicing
environmentally
friendly business
Materiality for stakeholders
Materiality for business
Environment-focused branding
Addressing energy/climate change problems
Resolution of environmental issues by suppliers
Ecosystem destruction
(forests)
Depletion of resources
(water resources)
Energy/climate
change problems
Water pollution
Air pollution
Lagging behind in
environmentally friendly
business practices
Soil pollution
Environmental requests from
customers (products)
Depletion of resources
(petroleum-based
resources)
Tightening of chemical
substance regulations
(products, production)
Lagging behind in government and
other procurement standards
Environment protection
around plants
Management of
waste laws compliance
Non-financial information disclosure
Materiality for stakeholders
Materiality for business
Product recycling
Depletion of resources
(rare metals)
22
KONICA MINOLTA, INC. Annual Report 2015
Foundation for GrowthBusiness StrategiesGrowth StrategyCompany Overview and Characteristics Financial Report