Konica Minolta 2015 Annual Report Download - page 102
Download and view the complete annual report
Please find page 102 of the 2015 Konica Minolta annual report below. You can navigate through the pages in the report by either clicking on the pages listed below, or by using the keyword search tool below to find specific information within the annual report.-
 1
1 -
2
-
3
-
4
-
5
-
6
-
7
-
8
-
9
-
10
-
11
-
12
-
13
-
14
-
15
-
16
-
17
-
18
-
19
-
20
-
21
-
22
-
23
-
24
-
25
-
26
-
27
-
28
-
29
-
30
-
31
-
32
-
33
-
34
-
35
-
36
-
37
-
38
-
39
-
40
-
41
-
42
-
43
-
44
-
45
-
46
-
47
-
48
-
49
-
50
-
51
-
52
-
53
-
54
-
55
-
56
-
57
-
58
-
59
-
60
-
61
-
62
-
63
-
64
-
65
-
66
-
67
-
68
-
69
-
70
-
71
-
72
-
73
-
74
-
75
-
76
-
77
-
78
-
79
-
80
-
81
-
82
-
83
-
84
-
85
-
86
-
87
-
88
-
89
-
90
-
91
-
 92
92 -
 93
93 -
 94
94 -
 95
95 -
 96
96 -
 97
97 -
 98
98 -
 99
99 -
 100
100 -
 101
101 -
 102
102 -
 103
103 -
 104
104 -
 105
105 -
 106
106 -
 107
107 -
 108
108 -
 109
109 -
 110
110 -
 111
111 -
 112
112 -
113
-
114
-
115
-
116
-
117
-
118
-
119
-
120
-
121
-
122
-
123
-
124
-
125
-
126
-
127
-
128
-
129
-
130
-
131
-
132
-
133
-
134
-
135
-
136
-
137
-
138
-
139
-
140
-
141
-
142
-
143
-
144
 |
 |

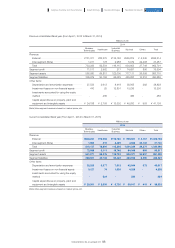
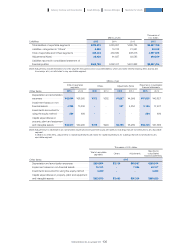
Millions of yen
Thousands of
U.S. dollars
2015 2014 2013 2015
Japan ······························································································································································· ¥143,804 ¥138,296 ¥134,821 $1,196,671
United States ······································································································································ 84,778 76,859 74,346 705,484
European countries ·················································································································· 53,945 60,356 49,140 448,906
China ································································································································································· 20,816 20,210 20,028 173,221
Asia, excluding Japan and China ···································································· 9,568 5,794 17,408 79,621
Others ····························································································································································· 4,786 1,449 1,573 39,827
Total ···································································································································································· ¥317,699 ¥302,966 ¥297,317 $2,643,746
(Note) Revenue classifications are based on customers’ geographical regions. However, individual items not allocable to a primary country are classified
in “Others.”
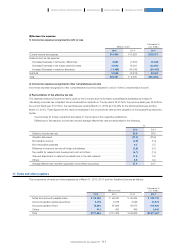
(3) Financial information by geographical region
External revenue by geographical area is as follows:
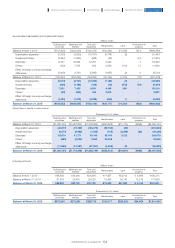
Summary by geographical region of the carrying amounts of non-current assets (excluding financial assets, deferred tax assets and
post-retirement benefit assets) is set out as follows:
(4) Information on principal customers
No single external customer contributed to 10% of revenue or more.
Millions of yen
Thousands of
U.S. dollars
2015 2014 2015
Japan ······························································································································································································································ ¥ 194,645 ¥204,792 $1,619,747
United States ····································································································································································································· 235,628 205,810 1,960,789
European countries ················································································································································································· 328,663 309,624 2,734,984
China ································································································································································································································ 68,055 58,484 566,323
Asia, excluding Japan and China ··································································································································· 88,578 85,472 737,106
Others ···························································································································································································································· 87,187 71,029 725,530
Total ··································································································································································································································· ¥1,002,758 ¥935,214 $8,344,495
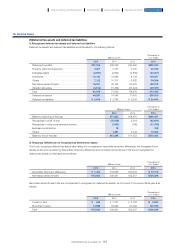
Millions of yen
Thousands of
U.S. dollars
2015 2014 2013 2015
Notes and accounts receivable–trade ···················································· ¥225,816 ¥219,247 ¥192,851 $1,879,138
Finance lease receivables ····························································································· 23,010 21,211 16,007 191,479
Others ····························································································································································· 10,193 12,251 10,325 84,822
Allowance for doubtful accounts ······································································ (6,057) (5,643) (4,568) (50,404)
Total ···································································································································································· ¥252,962 ¥247,067 ¥214,616 $2,105,035
The components of trade and other receivables as of March 31, 2015, 2014, and the Transition Date are as follows:
7. Trade and other receivables
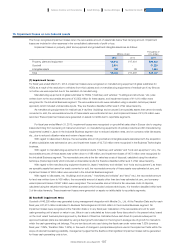
For fiscal year ended March 31, 2014, contingent consideration related to an equity interest acquired in Instrument Systems GmbH
dated of November 30, 2012 are measured at fair value on the Transition Date and recorded in “other financial liabilities.” Under the
agreement with the acquired company, a contingent consideration is to be paid if performance levels exceed certain level. That
estimated amount is calculated by taking into account the time value, of money specific to the acquired company. The fair value of
the contingent consideration as of the Transition Date is ¥603 million, and the fair value of the contingent consideration as of the
settlement date is ¥709 million. The changes in far value between the Transition Date and the settlement date, resulting from
changes in exchange rates and time value are recorded as “finance costs.”
There was no significant business combination in the fiscal year ended March 31, 2015.
6. Business Combinations
101
KONICA MINOLTA, INC. Annual Report 2015
Foundation for GrowthBusiness StrategiesGrowth StrategyCompany Overview and Characteristics Financial Report