Konica Minolta 2015 Annual Report Download - page 75
Download and view the complete annual report
Please find page 75 of the 2015 Konica Minolta annual report below. You can navigate through the pages in the report by either clicking on the pages listed below, or by using the keyword search tool below to find specific information within the annual report.
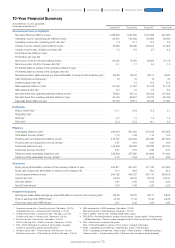
Fiscal 2009 Fiscal 2010 Fiscal 2011 Fiscal 2012
Fiscal 2012 (IFRS)*
20
Fiscal 2013 Fiscal 2013 (IFRS) Fiscal 2014 Fiscal 2014 (IFRS)
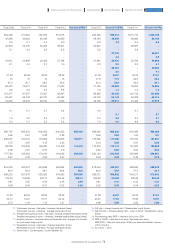
804,465 777,953 767,879 813,073 -943,759 935,214 1,011,774 1,002,758
43,988 40,022 40,346 40,659 -58,144 39,859 66,200 65,762
5.5 5.1 5.3 5.0 -6.2 4.3 6.5 6.6
40,818 33,155 34,758 38,901 -54,621 -59,867 -
5.1 4.3 4.5 4.8 -5.8 -5.9 -
---- --37,736 -65,491
---- --4.0 -6.5
16,931 25,896 20,424 15,124 -21,861 28,431 32,706 40,969
2.1 3.3 2.7 1.9 -2.3 3.0 3.2 4.1
---- --28,354 -40,934
---- --3.0 -4.1
31.93 48.84 38.52 28.52 -41.38 53.67 64.73 81.01
15 15 15 15 -17.5 17.5 20.0 20.0
47.0 30.7 38.9 52.6 -42.3 32.6 30.9 24.7
68,475 72,617 72,530 71,533 -71,184 69,599 75,281 74,295
8.5 9.3 9.4 8.8 -7.5 7.4 7.4 7.4
113,377 67,957 72,367 66,467 -89,945 90,058 101,733 101,989
-40,457 -44,738 -42,757 -63,442 --55,776 -54,143 -54,308 -54,014
72,920 23,219 29,610 3,025 -34,169 35,914 47,425 47,975
4.1 6.1 4.7 3.4 -4.6 -6.7 -
---- --6.1 -8.7
1.9 3.0 2.3 1.6 -2.3 2.9 3.4 4.1
5.3 5.1 5.2 5.2 -7.3 5.0 8.6 8.3
865,797 845,453 902,052 940,553 958,439 966,060 985,239 970,485 994,256
0.90 0.91 0.88 0.88 -0.99 0.96 1.04 1.01
205,057 190,701 178,999 179,903 180,311 173,362 177,056 175,100 181,641
3.72 3.93 4.15 4.53 -5.34 5.23 5.81 5.59
98,263 100,243 105,080 112,479 113,472 115,275 115,175 121,067 120,803
2.68 2.67 2.81 2.6 -2.52 2.82 2.53 2.54
177,720 163,363 174,193 194,038 208,859 220,120 240,459 226,899 248,827
2.47 2.42 2.52 2.47 -2.53 3.09 2.45 2.72
419,535 427,647 433,669 464,904 465,830 478,404 492,081 499,596 528,432
48.5 50.6 48.1 49.4 48.6 49.5 49.9 51.5 53.1
489,253 501,876 565,923 579,593 559,806 589,331 569,552 594,271 570,640
183.03 206.98 247.17 205.04 198.14 206.62 200.83 209.69 202.43
0.47 0.45 0.53 0.48 0.49 0.41 0.41 0.32 0.31
0.08 0.04 -0.01 0.02 0.03 0.02 0.03 -0.04 -0.02
31.93 48.84 38.52 28.52 -41.38 53.67 64.73 81.01
34.17 14.27 18.77 24.12 -23.27 17.94 18.86 15.07
0.73 1.16 1.13 1.27 -0.96 0.99 0.82 0.86
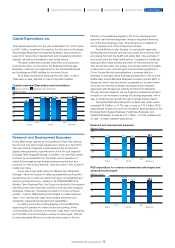
*11. Total assets turnover = Net sales / Average total assets (times)
Total assets turnover = Revenue / Average total assets (times)
*12. Tangible fixed assets turnover = Net sales / Average tangible fixed assets (times)
Tangible fixed assets turnover = Revenue / Average tangible fixed assets (times)
*13. Inventory turnover = Inventory balance at fiscal year end / Average cost of sales
for most recent three months
*14. Receivables turnover = Net sales / Average receivables (times)
Receivables turnover = Revenue / Average receivables (times)
*15. Current ratio = Current assets / Current liabilities (%)
*16. D/E ratio = Interest-bearing debt / Shareholders’ equity (times)
*17. Net D/E ratio = (Interest-bearing debt – Cash on hand) / Shareholders’ equity
(times)
*18. Price-earnings ratio (PER) = Year-end stock price / EPS
*19. PBR (J-GAAP) = Year-end stock price / Net assets per share
PBR (IFRS) = Year-end stock price / Equity per share attributable to owners
of the company
*20. As of April 1, 2013
74
KONICA MINOLTA, INC. Annual Report 2015
Foundation for GrowthBusiness StrategiesGrowth StrategyCompany Overview and Characteristics Financial Report


