Konica Minolta 2015 Annual Report Download - page 80
Download and view the complete annual report
Please find page 80 of the 2015 Konica Minolta annual report below. You can navigate through the pages in the report by either clicking on the pages listed below, or by using the keyword search tool below to find specific information within the annual report.-
 1
1 -
2
-
3
-
4
-
5
-
6
-
7
-
8
-
9
-
10
-
11
-
12
-
13
-
14
-
15
-
16
-
17
-
18
-
19
-
20
-
21
-
22
-
23
-
24
-
25
-
26
-
27
-
28
-
29
-
30
-
31
-
32
-
33
-
34
-
35
-
36
-
37
-
38
-
39
-
40
-
41
-
42
-
43
-
44
-
45
-
46
-
47
-
48
-
49
-
50
-
51
-
52
-
53
-
54
-
55
-
56
-
57
-
58
-
59
-
60
-
61
-
62
-
63
-
64
-
65
-
66
-
67
-
68
-
69
-
 70
70 -
 71
71 -
 72
72 -
 73
73 -
 74
74 -
 75
75 -
 76
76 -
 77
77 -
 78
78 -
 79
79 -
 80
80 -
 81
81 -
 82
82 -
 83
83 -
 84
84 -
 85
85 -
 86
86 -
 87
87 -
 88
88 -
 89
89 -
 90
90 -
91
-
92
-
93
-
94
-
95
-
96
-
97
-
98
-
99
-
100
-
101
-
102
-
103
-
104
-
105
-
106
-
107
-
108
-
109
-
110
-
111
-
112
-
113
-
114
-
115
-
116
-
117
-
118
-
119
-
120
-
121
-
122
-
123
-
124
-
125
-
126
-
127
-
128
-
129
-
130
-
131
-
132
-
133
-
134
-
135
-
136
-
137
-
138
-
139
-
140
-
141
-
142
-
143
-
144
 |
 |

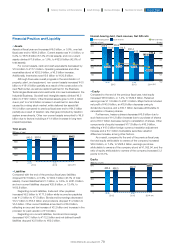
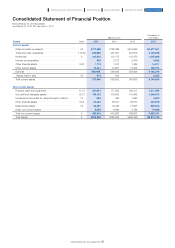
• Equity
Compared to the end of the previous fiscal year, total equity
increased ¥36.6 billion, or 7.4%, to ¥529.5 billion. Retained
earnings rose ¥11.8 billion to ¥251.3 billion. Major factors included
net profit of ¥40.9 billion, an ¥8.9 billion decrease owing to
dividends of surplus, and a ¥20.7 billion decrease attributable to
cancelation of treasury shares.
Furthermore, treasury shares decreased ¥6.5 billion due to
such factors as a ¥14.2 billion increase due to purchase of shares
and a ¥20.7 billion decrease owing to cancellation of shares. Other
components of equity increased ¥17.8 billion to ¥45.9 billion,
reflecting a ¥15.0 billion foreign currency translation adjustment
increase and a ¥3.1 billion marketable securities valuation
difference increase, among other factors.
As a result, compared to the end of the previous fiscal year,
the total equity attributable to owners of the company increased
¥36.3 billion, or 7.4%, to ¥528.4 billion, earnings per share
attributable to owners of the company stood at ¥1,052.94, and the
ratio of equity attributable to owners of the company increased 3.2
points to 53.1%.
• Liabilities
Compared with the end of the previous fiscal year, liabilities
dropped ¥27.6 billion, or 5.6%, to ¥464.7 billion (46.7% of total
assets). Current liabilities fell ¥1.7 billion, or 0.6%, to ¥281.8 billion
and non-current liabilities dropped ¥25.9 billion, or 12.4%, to
¥182.8 billion.
Regarding current liabilities, trade and other payables
increased ¥6.2 billion to ¥177.5 billion while income tax payables
rose ¥1.2 billion to ¥7.5 billion. Bonds and borrowings decreased
¥12.7 billion to ¥53.3 billion and provisions dropped ¥1.2 billion to
¥5.5 billion. Other current liabilities amounted to ¥36.8 billion,
reflecting an accrued tax increase of ¥2.2 billion and increase in the
provision for paid vacation of ¥1.9 billion.
Regarding non-current liabilities, bonds and borrowings
decreased ¥24.1 billion to ¥112.2 billion and net defined benefit
liabilities dropped ¥2.8 billion to ¥62.0 billion.
• Assets
Assets at fiscal year end increased ¥9.0 billion, or 0.9%, over last
fiscal year end to ¥994.2 billion. Current assets rose ¥1.0 billion, or
0.2%, to ¥570.6 billion (57.4% of total assets), and non-current
assets climbed ¥7.9 billion, or 1.9%, to ¥423.6 billion (42.6% of
total assets).
For current assets, cash and cash equivalents decreased by
¥10.9 billion to ¥177.4 billion. Operating receivables and other
receivables stood at ¥252.9 billion, a ¥5.8 billion increase.
Additionally, inventories rose ¥5.6 billion to ¥120.8 billion.
Although there was overall progress in the amortization of
property, plant, and equipment, non-current assets increased ¥4.5
billion to ¥181.6 billion partially as a result of the construction of a
new R&D center, as well as capital investment in the Business
Technologies Business and investments into new businesses in the
Industrial Business. Goodwill and intangible assets climbed ¥6.5
billion to ¥126.1 billion. Other financial assets grew to ¥41.4 billion
due in part to a ¥2.9 billion increase in investment in securities
caused by a rising stock market, while deferred tax assets fell
¥10.0 billion compared to previous fiscal year end to ¥64.2 billion
partially as a result of taxation rate changes prompted by taxation
system amendments. Other non-current assets amounted to ¥9.6
billion due to factors including a ¥1.4 billion increase in long-term
prepaid expenses.
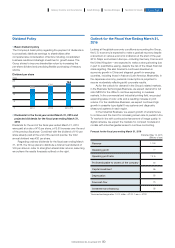
Financial Position and Liquidity
Equity
Total assets
Interest-bearing debt, Cash reserves, Net D/E ratio
600
450
300
150
0
(Billions of yen)
492.8
466.4 466.5
529.5
20132012 2014
(FY)
J-GAAP IFRS
300
240
180
120
60
0
0.3
0.2
0.1
0
-0.1
-0.2
(Billions of yen) (times)
Interest-bearing Debt Cash reserves Net D/E Ratio
0.02%
224.9 213.9 214.5 202.4
165.6 177.4
0.03%
-0.02%
0.03%
20132012 2014
(FY)
J-GAAP IFRS
230.4
188.4
1,200
900
600
300
0
(Billions of yen)
985.2
940.5 958.4 994.2
20132012 2014
(FY)
J-GAAP IFRS
79
KONICA MINOLTA, INC. Annual Report 2015
Foundation for GrowthBusiness StrategiesGrowth StrategyCompany Overview and Characteristics Financial Report