Konica Minolta 2015 Annual Report Download - page 124
Download and view the complete annual report
Please find page 124 of the 2015 Konica Minolta annual report below. You can navigate through the pages in the report by either clicking on the pages listed below, or by using the keyword search tool below to find specific information within the annual report.-
 1
1 -
2
-
3
-
4
-
5
-
6
-
7
-
8
-
9
-
10
-
11
-
12
-
13
-
14
-
15
-
16
-
17
-
18
-
19
-
20
-
21
-
22
-
23
-
24
-
25
-
26
-
27
-
28
-
29
-
30
-
31
-
32
-
33
-
34
-
35
-
36
-
37
-
38
-
39
-
40
-
41
-
42
-
43
-
44
-
45
-
46
-
47
-
48
-
49
-
50
-
51
-
52
-
53
-
54
-
55
-
56
-
57
-
58
-
59
-
60
-
61
-
62
-
63
-
64
-
65
-
66
-
67
-
68
-
69
-
70
-
71
-
72
-
73
-
74
-
75
-
76
-
77
-
78
-
79
-
80
-
81
-
82
-
83
-
84
-
85
-
86
-
87
-
88
-
89
-
90
-
91
-
92
-
93
-
94
-
95
-
96
-
97
-
98
-
99
-
100
-
101
-
102
-
103
-
104
-
105
-
106
-
107
-
108
-
109
-
110
-
111
-
112
-
113
-
 114
114 -
 115
115 -
 116
116 -
 117
117 -
 118
118 -
 119
119 -
 120
120 -
 121
121 -
 122
122 -
 123
123 -
 124
124 -
 125
125 -
 126
126 -
 127
127 -
 128
128 -
 129
129 -
 130
130 -
 131
131 -
 132
132 -
 133
133 -
 134
134 -
135
-
136
-
137
-
138
-
139
-
140
-
141
-
142
-
143
-
144
 |
 |
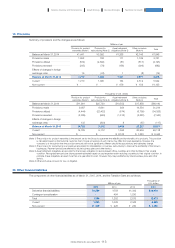
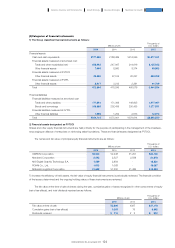
The Group uses valuation technique, i.e. Black-Scholes model, to estimate the fair value of the share options, and the primary
underlying data and estimation methods are as follows:
(Note 1) Calculations are based on share price performance up to the grant date, according to expected option life.
(Note 2) Estimates are based on the weighted average appointment period of grantees and the subsequent exercisable period for rights.
(Note 3) Estimates are based on past dividend performance and the Company’s dividend policy.
(Note 4) This is the compound interest yield on long-term interest-bearing government bonds within three months of the redemption date from the
expected option life.
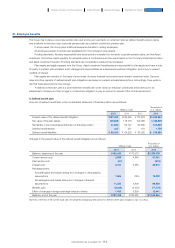
(Note) Profit for the year attributable to owners of the Company / equity attributable to owners of the Company (average for the period)
(Note 1) Equity attributable to owners of the Company / total equity
(Note 2) Interest-bearing debt / equity attributable to owners of the Company
(Note 3) (Interest-bearing debt - cash and cash equivalents) / equity attributable to owners of the Company
2015 2014
10th 9th
Share price at the date of grant (Yen) ··············································································································································· ¥1,228 ¥799
Exercise price (Yen) ·········································································································································································································· ¥ 1 ¥ 1
Expected volatility (Note 1) ·················································································································································································· 39.743% 40.573%
Expected option life (Note 2) ··········································································································································································· 9yrs10mnts 8yrs10mnts
Expected dividends (Per share) (Note 3) ··································································································································· ¥ 17.50 ¥ 15.00
Risk-free interest rate (Note 4) ······································································································································································ 0.530% 0.669%
2015 2014
ROE (Note) ······································································································································································································································ 8.0% 5.9%
2015 2014 2013
Equity ratio (Note 1) ···················································································································· 53.1% 49.9% 48.6%
D/E ratio (Note 2) ·························································································································· 0.31 times 0.41 times 0.49 times
Net D/E ratio (Note 3) ·············································································································· - 0.02 times 0.03 times 0.03 times
(1) Capital management
The Group actively monitors and manages its capital and debt structure in relation to economic conditions and current company
circumstances, and raises necessary funds for working capital, capital expenditure, investment and loans and other items. Short-
term working capital is primarily funded through bank loans. In addition, the Group maintains commitment-type credit lines with
financial institutions. These credit lines are limited to 100 billion Japanese yen and with expire at the end of September 2019.
Temporary surpluses are invested in extremely safe financial assets.
Under “TRANSFORM 2016,” the Group’s three-year medium-term plan from fiscal year 2014 through fiscal year 2016, the
Group is working to boost capital efficiency, streamline the balance sheet and strengthen shareholder returns. The Group aims to
achieve return on equity (ROE) of 10% or more by fiscal year 2016 . (This figure is based on shareholders’ equity under Japanese
GAAP, and is the total of share capital, share premium, retained earnings and treasury shares.) The Group is not subject to any
material capital restrictions.
The principal indicators the Company uses for capital management are as follows:
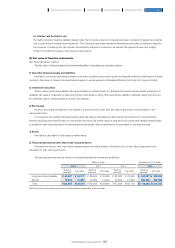
32. Financial instruments
123
KONICA MINOLTA, INC. Annual Report 2015
Foundation for GrowthBusiness StrategiesGrowth StrategyCompany Overview and Characteristics Financial Report