Konica Minolta 2015 Annual Report Download - page 88
Download and view the complete annual report
Please find page 88 of the 2015 Konica Minolta annual report below. You can navigate through the pages in the report by either clicking on the pages listed below, or by using the keyword search tool below to find specific information within the annual report.-
 1
1 -
2
-
3
-
4
-
5
-
6
-
7
-
8
-
9
-
10
-
11
-
12
-
13
-
14
-
15
-
16
-
17
-
18
-
19
-
20
-
21
-
22
-
23
-
24
-
25
-
26
-
27
-
28
-
29
-
30
-
31
-
32
-
33
-
34
-
35
-
36
-
37
-
38
-
39
-
40
-
41
-
42
-
43
-
44
-
45
-
46
-
47
-
48
-
49
-
50
-
51
-
52
-
53
-
54
-
55
-
56
-
57
-
58
-
59
-
60
-
61
-
62
-
63
-
64
-
65
-
66
-
67
-
68
-
69
-
70
-
71
-
72
-
73
-
74
-
75
-
76
-
77
-
 78
78 -
 79
79 -
 80
80 -
 81
81 -
 82
82 -
 83
83 -
 84
84 -
 85
85 -
 86
86 -
 87
87 -
 88
88 -
 89
89 -
 90
90 -
 91
91 -
 92
92 -
 93
93 -
 94
94 -
 95
95 -
 96
96 -
 97
97 -
 98
98 -
99
-
100
-
101
-
102
-
103
-
104
-
105
-
106
-
107
-
108
-
109
-
110
-
111
-
112
-
113
-
114
-
115
-
116
-
117
-
118
-
119
-
120
-
121
-
122
-
123
-
124
-
125
-
126
-
127
-
128
-
129
-
130
-
131
-
132
-
133
-
134
-
135
-
136
-
137
-
138
-
139
-
140
-
141
-
142
-
143
-
144
 |
 |

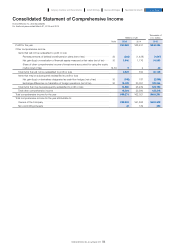
Consolidated Statement of Cash Flows
Konica Minolta, Inc. and Subsidiaries
For the fiscal years ended March 31, 2015 and 2014
Millions of yen
Thousands of
U.S. dollars
Note 2015 2014 2015
Cash flows from operating activities
Profit before tax ······························································································································································································································································ ¥ 65,491 ¥ 37,736 $ 544,986
Depreciation and amortization expenses ··········································································································································································· 47,905 43,827 398,644
Impairment losses ······················································································································································································································································ 5,185 17,487 43,147
Share of profit or loss in investments accounted for using the equity method ················································· (35) 1,163 (291)
Interest and dividend income ················································································································································································································· (2,533) (2,122) (21,078)
Interest expenses ························································································································································································································································ 2,398 2,852 19,955
(Gain) loss on sales and disposals of property, plant and equipment and intangible
assets ······························································································································································································································································································ (1,152) 2,048 (9,586)
Loss (gain) on sales of investments in subsidiaries ·········································································································································· 949 - 7,897
(Increase) decrease in trade and other receivables ·········································································································································· 10,622 (1,710) 88,391
(Increase) decrease in inventories ··································································································································································································· 685 9,198 5,700
Increase (decrease) in trade and other payables ·················································································································································· (5,586) (617) (46,484)
Decrease on transfer of lease assets ························································································································································································ (6,785) (5,837) (56,462)
Increase (decrease) in retirement benefit liabilities ·············································································································································· (2,960) (1,412) (24,632)
Others ····························································································································································································································································································· (595) 2,073 (4,951)
Subtotal ··············································································································································································································································································· 113,588 104,687 945,228
Dividends received ···················································································································································································································································· 853 493 7,098
Interest received ···························································································································································································································································· 1,682 1,598 13,997
Interest paid ·········································································································································································································································································· (2,386) (2,927) (19,855)
Income taxes paid ····················································································································································································································································· (11,748) (13,793) (97,762)
Net cash flows from operating activities ·············································································································································································· 101,989 90,058 848,706
Cash flows from investing activities
Purchase of property, plant and equipment ·································································································································································· (39,063) (36,487) (325,064)
Proceeds from sales of property, plant and equipment ···························································································································· 8,630 2,355 71,815
Purchase of intangible assets ················································································································································································································ (8,676) (8,654) (72,198)
Purchase of investments in subsidiaries ·············································································································································································· (4,360) (2,393) (36,282)
Purchase of investment securities ································································································································································································· (729) (4,910) (6,066)
Proceeds from sales of investment securities ··························································································································································· 3,266 397 27,178
Payment for loans receivable ·················································································································································································································· (97) (306) (807)
Collection of loans receivable ················································································································································································································· 83 159 691
Payments for transfer of business ································································································································································································· (6,709) (2,102) (55,829)
Others ····························································································································································································································································································· (6,358) (2,199) (52,908)
Net cash flows from investing activities ················································································································································································ (54,014) (54,143) (449,480)
Cash flows from financing activities
Increase (decrease) in short-term loans payable ·················································································································································· (11,411) (35,013) (94,957)
Proceeds from bonds issuance and long-term loans payable ····································································································· - 25,598 -
Redemption of bonds and repayments of long-term loans payable ·················································································· (30,493) (26,805) (253,749)
Purchase of treasury shares ····················································································································································································································· (13,509) (15,806) (112,416)
Cash dividends paid ·············································································································································································································································· 23 (8,908) (9,284) (74,128)
Payments for acquisition of interests in subsidiaries from non-controlling interests ································ (293) (1,633) (2,438)
Others ····························································································································································································································································································· 2,486 (727) 20,687
Net cash flows from financing activities ················································································································································································ (62,128) (63,672) (517,001)
Effect of exchange rate changes on cash and cash equivalents ······································································································ 3,160 1,690 26,296
Net increase (decrease) in cash and cash equivalents ········································································································································ (10,993) (26,067) (91,479)
Cash and cash equivalents at the beginning of the year ································································································································· 188,489 214,556 1,568,520
Cash and cash equivalents at the end of the year ····················································································································································· ¥177,496 ¥188,489 $1,477,041
87
KONICA MINOLTA, INC. Annual Report 2015
Foundation for GrowthBusiness StrategiesGrowth StrategyCompany Overview and Characteristics Financial Report