Konica Minolta 2015 Annual Report Download - page 125
Download and view the complete annual report
Please find page 125 of the 2015 Konica Minolta annual report below. You can navigate through the pages in the report by either clicking on the pages listed below, or by using the keyword search tool below to find specific information within the annual report.-
 1
1 -
2
-
3
-
4
-
5
-
6
-
7
-
8
-
9
-
10
-
11
-
12
-
13
-
14
-
15
-
16
-
17
-
18
-
19
-
20
-
21
-
22
-
23
-
24
-
25
-
26
-
27
-
28
-
29
-
30
-
31
-
32
-
33
-
34
-
35
-
36
-
37
-
38
-
39
-
40
-
41
-
42
-
43
-
44
-
45
-
46
-
47
-
48
-
49
-
50
-
51
-
52
-
53
-
54
-
55
-
56
-
57
-
58
-
59
-
60
-
61
-
62
-
63
-
64
-
65
-
66
-
67
-
68
-
69
-
70
-
71
-
72
-
73
-
74
-
75
-
76
-
77
-
78
-
79
-
80
-
81
-
82
-
83
-
84
-
85
-
86
-
87
-
88
-
89
-
90
-
91
-
92
-
93
-
94
-
95
-
96
-
97
-
98
-
99
-
100
-
101
-
102
-
103
-
104
-
105
-
106
-
107
-
108
-
109
-
110
-
111
-
112
-
113
-
114
-
 115
115 -
 116
116 -
 117
117 -
 118
118 -
 119
119 -
 120
120 -
 121
121 -
 122
122 -
 123
123 -
 124
124 -
 125
125 -
 126
126 -
 127
127 -
 128
128 -
 129
129 -
 130
130 -
 131
131 -
 132
132 -
 133
133 -
 134
134 -
 135
135 -
136
-
137
-
138
-
139
-
140
-
141
-
142
-
143
-
144
 |
 |
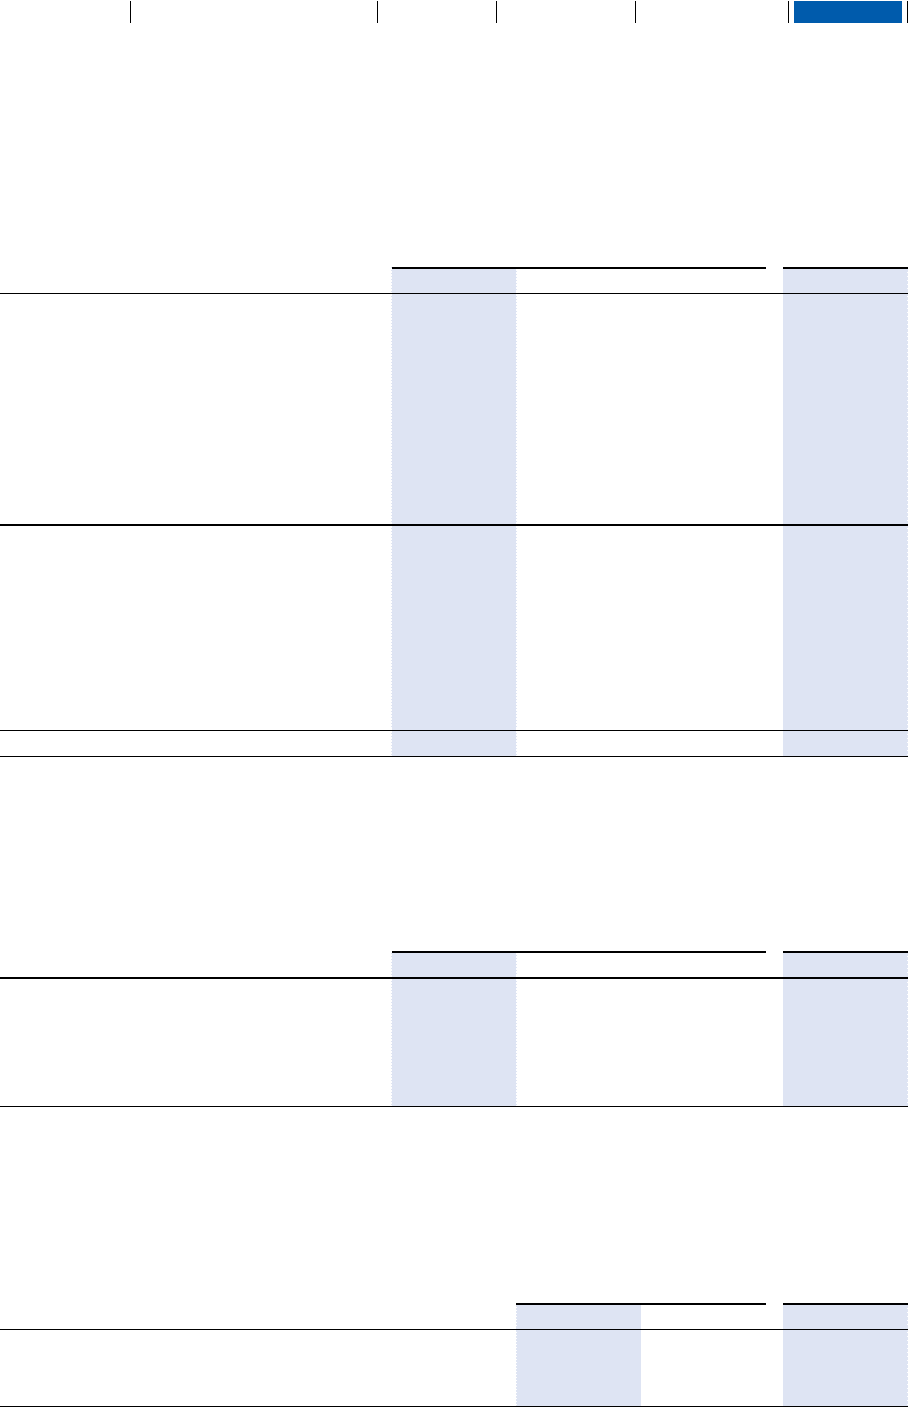
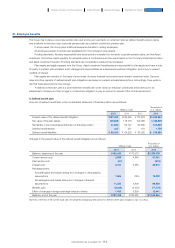
(2)Categories of financial instruments
1) The Group classifies financial instruments as follows:
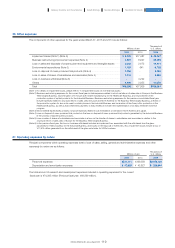
2) Financial assets designated as FVTOCI
Shares and other equity financial instruments are held primarily for the purpose of participating in the management of the investees,
encouraging an alliance of enterprises or reinforcing sales foundations. These are financial assets designated as FVTOCI.
The names and fair value of principal equity financial instruments are as follows:
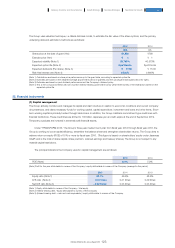
To increase the efficiency of held assets, the fair value of equity financial instruments is periodically reviewed. The financial condition
of the issuers determined and the ongoing holding status of these instruments are reviewed.
The fair value at the time of sale of shares during the year, cumulative gains or losses recognized in other components of equity
(net of tax effects), and total dividends received are as follows:
Millions of yen
Thousands of
U.S. dollars
2015 2014 2013 2015
Financial assets
Cash and cash equivalents ························································································ ¥177,496 ¥188,489 ¥214,556 $1,477,041
Financial assets measured at amortized cost
Trade and other receivables (net) ···························································· 252,962 247,067 214,616 2,105,035
Other financial assets ·································································································· 7,690 8,960 8,374 63,993
Financial assets measured at FVTOCI
Other financial assets ·································································································· 30,428 27,514 20,237 253,208
Financial assets measured at FVTPL
Other financial assets ·································································································· 5,017 3,213 2,291 41,749
Total ···································································································································································· 473,594 475,245 460,076 3,941,034
Financial liabilities
Financial liabilities measured at amortized cost
Trade and other payables ···················································································· 177,564 171,309 146,605 1,477,607
Bonds and borrowings ····························································································· 165,586 202,439 230,435 1,377,931
Financial liabilities measured at FVTPL
Other financial liabilities ···························································································· 1,559 1,252 2,573 12,973
Total ···································································································································································· ¥344,710 ¥375,001 ¥379,614 $2,868,520
Millions of yen
Thousands of
U.S. dollars
2015 2014 2013 2015
OMRON Corporation ············································································································ ¥2,900 ¥2,248 ¥1,291 $24,132
Marubeni Corporation ········································································································· 2,593 2,527 2,588 21,578
MGI Digital Graphic Technology S.A. ························································ 1,829 2,884 - 15,220
ROHM Co., Ltd. ···························································································································· 1,813 1,068 - 15,087
Mitsubishi Logistics Corporation ······································································ ¥1,642 ¥1,200 ¥1,486 $13,664
Millions of yen
Thousands of
U.S. dollars
2015 2014 2015
Fair value at time of sale ································································································································································· ¥3,266 ¥397 $27,178
Cumulative gains (net of tax effects) ·························································································································· 1,065 75 8,862
Dividends received ··················································································································································································· ¥ 112 ¥ 2 $ 932
124
KONICA MINOLTA, INC. Annual Report 2015
Foundation for GrowthBusiness StrategiesGrowth StrategyCompany Overview and Characteristics Financial Report