Konica Minolta 2015 Annual Report Download - page 119
Download and view the complete annual report
Please find page 119 of the 2015 Konica Minolta annual report below. You can navigate through the pages in the report by either clicking on the pages listed below, or by using the keyword search tool below to find specific information within the annual report.-
 1
1 -
2
-
3
-
4
-
5
-
6
-
7
-
8
-
9
-
10
-
11
-
12
-
13
-
14
-
15
-
16
-
17
-
18
-
19
-
20
-
21
-
22
-
23
-
24
-
25
-
26
-
27
-
28
-
29
-
30
-
31
-
32
-
33
-
34
-
35
-
36
-
37
-
38
-
39
-
40
-
41
-
42
-
43
-
44
-
45
-
46
-
47
-
48
-
49
-
50
-
51
-
52
-
53
-
54
-
55
-
56
-
57
-
58
-
59
-
60
-
61
-
62
-
63
-
64
-
65
-
66
-
67
-
68
-
69
-
70
-
71
-
72
-
73
-
74
-
75
-
76
-
77
-
78
-
79
-
80
-
81
-
82
-
83
-
84
-
85
-
86
-
87
-
88
-
89
-
90
-
91
-
92
-
93
-
94
-
95
-
96
-
97
-
98
-
99
-
100
-
101
-
102
-
103
-
104
-
105
-
106
-
107
-
108
-
 109
109 -
 110
110 -
 111
111 -
 112
112 -
 113
113 -
 114
114 -
 115
115 -
 116
116 -
 117
117 -
 118
118 -
 119
119 -
 120
120 -
 121
121 -
 122
122 -
 123
123 -
 124
124 -
 125
125 -
 126
126 -
 127
127 -
 128
128 -
 129
129 -
130
-
131
-
132
-
133
-
134
-
135
-
136
-
137
-
138
-
139
-
140
-
141
-
142
-
143
-
144
 |
 |

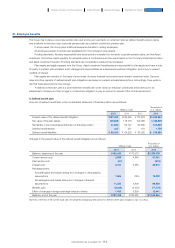
The components of other income for the years ended March 31, 2015 and 2014 are as follows:
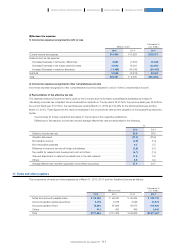
25. Other income
The components of revenue for fiscal years ended March 31, 2015 and 2014 are as follows:
24. Revenue
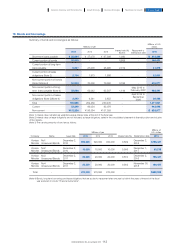
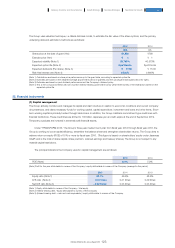
Dividend payments are as follows. The source of dividends is retained earnings.
23. Dividends
Dividends with an effective date in the following fiscal year are as follows. The source of dividends is retained earnings.
Previous fiscal year (From April 1, 2013 to March 31, 2014)
Current fiscal year (From April 1, 2014 to March 31, 2015)
Millions of Yen Yen
Resolution Class of shares Amount of
dividends
Dividends
per share Record date Effective
date
Board of Directors' meeting
held on May 10, 2013 Ordinary shares ¥3,977 ¥ 7.50 March 31,
2013
May 27,
2013
Board of Directors' meeting
held on October 31, 2013 Ordinary shares ¥5,303 ¥10.00 September
30, 2013
November
27, 2013
Millions of Yen Yen Thousands of
U.S. dollars U.S.dollars
Resolution Class of shares Amount of
dividends
Dividends
per share Record date Effective
date
Amount of
dividends
Dividends
per share
Board of Directors’ meeting
held on May 9, 2014 Ordinary shares ¥3,862 ¥ 7.50 March 31,
2014
May 27,
2014 $32,138 $0.06
Board of Directors’ meeting
held on October 31, 2014 Ordinary shares ¥5,039 ¥10.00 September
30, 2014
November
27, 2014 $41,932 $0.08
Millions of Yen Yen Thousands of
U.S. dollars U.S.dollars
Resolution Class of shares Amount of
dividends
Dividends
per share Record date Effective
date
Amount of
dividends
Dividends
per share
Board of Directors’ meeting
held on May 13, 2015 Ordinary shares ¥5,018 ¥10.00 March 31,
2015
May 28,
2015 $41,758 $0.08
(Note) Based on a resolution at a Board of Directors meeting held on October 31, 2013, the interim dividend of ¥10 per share includes a
commemorative dividend of ¥2.50.
Millions of yen
Thousands of
U.S. dollars
2015 2014 2015
Sales of goods ················································································································································································································· ¥ 591,891 ¥592,222 $4,925,447
Rendering of services ·························································································································································································· 410,866 342,992 3,419,040
Total ···················································································································································································································································· ¥1,002,758 ¥935,214 $8,344,495
Millions of yen
Thousands of
U.S. dollars
2015 2014 2015
Gain on sale of property, plant and equipment and intangible assets (Note) ······ ¥3,486 ¥ 624 $29,009
Gain on sale of patents ····················································································································································································· 81 809 674
Others ············································································································································································································································· 3,249 3,433 27,037
Total ···················································································································································································································································· ¥6,817 ¥4,866 $56,728
(Note) The gain on sale of property, plant and equipment and intangible assets in the current fiscal year was primarily attributable to the sale of idle
assets in Japan.
118
KONICA MINOLTA, INC. Annual Report 2015
Foundation for GrowthBusiness StrategiesGrowth StrategyCompany Overview and Characteristics Financial Report